
ISM Report on Business - Manufacturing - Highly Regarded Economic Indicators Report. OESA Automotive Supplier Barometer. The OESA Automotive Supplier Barometer captures the pulse and analyzes the twelve month business sentiments of top executives in the supplier industry.
It is a snapshot of their concerns on commercial issues, the business environment and strategies that influence the supplier industry. The OESA Automotive Supplier Barometer is distributed to vehicle manufacturers, financial institutions, governmental officials and the media to provide an on-going profile of the trends in the supplier industry.
For additional information about the OESA Automotive Supplier Barometer, contact Mike Jackson at 248.430.5954 or CLICK HERE to e-mail. Q1 Production and Planning. Thomas Manufacturing Index (TMX) A Fundamental Industrial Production Index The Thomas Manufacturing Index, or “TMX”, is a new index that measures industrial activity in the United States and Canada.
Every day thousands of engineers, procurement professionals, and logistics companies use Thomasnet.com to source suppliers and partners, download product specifications, and submit requests for proposals. These tens of thousands of daily actions are fundamental to industrial production and represent a true measure of the health of the manufacturing sector. TMX is built with anonymized first-party data representing a highly diverse set of companies including Fortune 1,000, Mid-Market, and SMBs. This depth and breadth of coverage makes TMX one of the most powerful financial and economic forward indicators to date. How to Interpret the Index TMX leads the stock market when industrial activity is driven by long term investments or major shifts in the manufacturing sector.
Reshoring Index - Kearney. Kearney’s seventh annual Reshoring Index revealed a dramatic reversal of a five-year trend, as domestic US manufacturing in 2019 commanded a significantly greater share versus the 14 Asian low-cost countries (LCCs) tracked in our study, with manufacturing imports from China registering a particularly sharp decline.
This year’s report also shares the second installment of the Kearney China diversification index (CDI), which tracks the rebalancing of US manufacturing imports from Asia away from China to other Asian LCCs, most notably Vietnam. New to this year’s report is the Kearney near-to-far trade ratio (NTFR), tracking the potentially significant nearshoring trend of sourcing manufactured goods from Mexico. 2019 saw companies actively adapting to what then felt like a major disruption—the US–China trade war—by reducing imports of manufactured goods from China while increasing manufacturing imports from the other countries in our Asia LCC sample, as well as from Mexico.
Pandemic Revenue Index. Fashion Transparency Index 2020 by Fashion Revolution. RSM Manufacturing Outlook Index - Shows Six-Standard-Deviation Hit. Fastener Distributor Index. December 2019 Fastener Distributor Index FDI, a collaboration between NFDA and FCH Sourcing Network, allows qualified industry participants to identify the trends they are experiencing in areas such as demand, pricing, inventories and outlook, through a monthly survey.
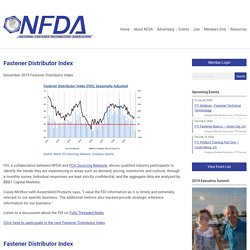
Individual responses are kept strictly confidential, and the aggregate data are analyzed by BB&T Capital Markets. Casey McIlhon with Assembled Products says, “I value the FDI information as it is timely and extremely relevant to our specific business. The additional metrics also tracked provide strategic reference information for our business. " Listen to a discussion about the FDI on Fully Threaded Radio. Manufacturing Economics: Gardner Web. Sunday, April 02, 2017 March GBI: 56.3 Durable goods manufacturing grew at its fastest rate since March 2014.

Read more ... Monday, March 27, 2017 Capacity Utilization Sees Fastest Growth since April 2015 The rate of change in capacity utilization is moving in direction consistent with our metalworking backlog index, which is point toward significant growth in capacity utilization. Durable Goods Production Growth Accelerating In February, production grew at its fastest rate since January 2015. Tuesday, March 21, 2017 Housing Permits Flat in February This was the lowest level since January 2016. Real 10-Yr Treasury Rate Lowest Since October But, the change from one year ago continued to climb. . « Prev | | Next » Gardner Business Index: Measures Activity at Durable Goods and Discrete Parts Manufacturing Facilities.
N. American Auto OEM-Supplier Working Relations Index. Industrial Production and Capacity Utilization. Release Date: July 15, 2016 Industrial production increased 0.6 percent in June after declining 0.3 percent in May.
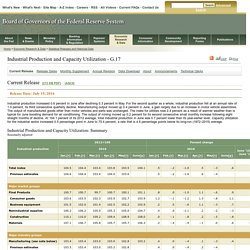
For the second quarter as a whole, industrial production fell at an annual rate of 1.0 percent, its third consecutive quarterly decline. Manufacturing output moved up 0.4 percent in June, a gain largely due to an increase in motor vehicle assemblies. The output of manufactured goods other than motor vehicles and parts was unchanged. The index for utilities rose 2.4 percent as a result of warmer weather than is typical for June boosting demand for air conditioning. Industrial Production and Capacity Utilization: Summary Seasonally adjusted r Revised. p Preliminary. The Higg Index – Sustainable Apparel Coalition. China Manufacturing Purchasing Managers Index (PMI)