
Citation Map: Visualizing the spread of scientific ideas through space and time The citation Map is designed to visualize the spread of scientific ideas through space and time (i.e., How publications are cited by researchers in different countries over the years ). Mapping such geographic distributions can help discover the patterns of citations which may not be detected by simply looking at the numbers. The Citation Map has a lot of potential applications. It can help researchers discover possible collaborators on the other side of the globe or remind academics of similar work being conducted in their own backyard. Additionally, it can help to visualize the geographic distribution of a particular research topic and stimulate thinking on the relationship between a specific research topic and particular regions (i.e. Why a research topic is so popular in certain areas). To use this Citation Map, users first enter keywords or author names, and a list of candidate publications will be shown.
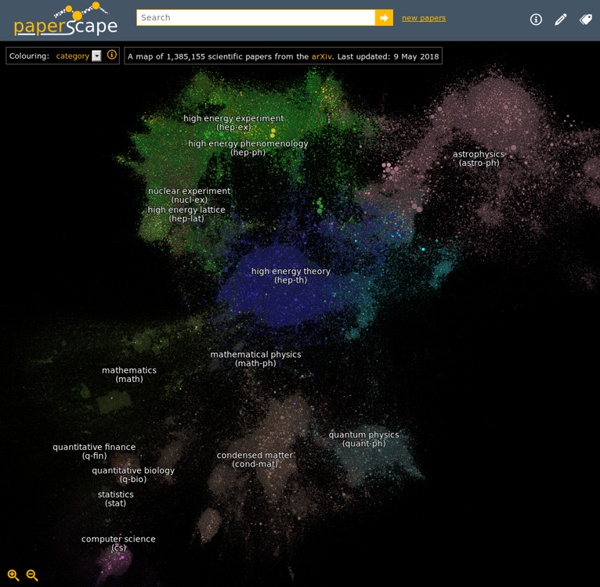
Paperscape About Paperscape Paperscape is an interactive map that visualises the arXiv, an open, online repository for scientific research papers. Each paper is represented by a circle, with the size of a circle related to how often that paper has been cited (referred to) - a measure of its impact. The papers are clustered together according to how they reference each other i.e. share information. Created by Damien George and Rob Knegjens. Online CAD software - NttCAD Recommended Version 7 Update 55 Select the file according to your operating system from the list below to get the latest Java for your computer. By downloading Java you acknowledge that you have read and accepted the terms of the end user license agreement <p><span class="termhighlight">In order to optimize your experience and provide you with accurate messages, please enable javascript in your browser for the duration of your Java installation. What is Java? Java allows you to play online games, chat with people around the world, calculate your mortgage interest, and view images in 3D, just to name a few. » What is Java FAQ» More information about Java Java software for your computer, or the Java Runtime Environment, is also referred to as the Java Runtime, Runtime Environment, Runtime, JRE, Java Virtual Machine, Virtual Machine, Java VM, JVM, VM, Java plug-in, Java plugin, Java add-on or Java download.
OWL - Semantic Web Standards Overview The W3C Web Ontology Language (OWL) is a Semantic Web language designed to represent rich and complex knowledge about things, groups of things, and relations between things. OWL is a computational logic-based language such that knowledge expressed in OWL can be exploited by computer programs, e.g., to verify the consistency of that knowledge or to make implicit knowledge explicit. OWL documents, known as ontologies, can be published in the World Wide Web and may refer to or be referred from other OWL ontologies. OWL is part of the W3C’s Semantic Web technology stack, which includes RDF, RDFS, SPARQL, etc. The current version of OWL, also referred to as “OWL 2”, was developed by the [W3C OWL Working Group] (now closed) and published in 2009, with a Second Edition published in 2012. Recommended Reading These documents are, however, all rather technical and mainly aimed at OWL 2 implementers and tool developers. Last modified and/or added All relevant tools
t1 | dbdsgnr Schema New Load Save(first login) Properties Insert TableAlt+T NoteAlt+N View Sort Collapse Line type Bezier Cornered Share Permalink Export SqlAlt+S Image Help Feedback About Try the new Beta Version Loading.......
13 Free Sites That Offer High-Quality 2D People and Objects for Your Architecture Visualizations | ArchDaily 13 Free Sites That Offer High-Quality 2D People and Objects for Your Architecture Visualizations October 23, 2017 Share FacebookTwitterPinterestWhatsappMail Or Even though a solid majority of architectural visualizations adhere to similar style guidelines, that doesn't mean you have to follow suit. escalalatina pngimg.com cutoutmix Ronen Bekerman & Case3D
Edit Pad - Online Text Editor Datavisualization.ch Selected Tools SpellCheck.net - Free Online Spell Checker Introduction to Circos, Features and Uses The Hollywood In$ider Explore data on over 1200 major Hollywood films of the last ten years. Click on the axis labels to view other data. View each year by itself. Or every single year at once. N.B. 250% of budget is considered the breakeven for Hollywood films due to the high costs of marketing (sometimes as much as twice the budget). Concept & Design: David McCandless // Research: Stephanie Smith, Ella Hollowood, Pearl Doughty-White // Code: Tom Evans, Paul Barton, Neil Muralee. » See the data for even more detail. » Sign up to be notified when we update this graphic. » Check out our beautiful books » Learn to be a dataviz ninja: Workshops are Beautiful
10 Awesome Twitter Analytics and Visualization Tools Recently Twitter rolled out their native analytics platform for all users and now you can get some quality data about your tweets directly from Twitter. After researching over a thousand Twitter Tools for the Twitter Tools Book I came across many Twitter analytics and visualization tools. These Twitter tools were designed to add value by presenting a different way to visualize or analyze your tweets, the people in your network, and the tweets from the people in your network. Many tools tried to add value and failed. The following tools, however, stand out in my mind as exceptional or entertaining and I recommend you check them out if you want to analyze and visualize your activity on Twitter. 1. TweepsMap is an excellent Twitter tool for both analyzing and visualizing your Twitter network. As it’s name suggests it does this by showing you how your followers are distributed on a map, in terms of percentages. You can see the distribution of my followers below. Intelligent publishing. Unique.