
40 Maps They Didn’t Teach You In School By the time we graduate high school, we learn that they never taught us the most interesting things in there. Sure, you might be able to name the European countries or point New York on the map, but does that give a you real understanding of how the world functions? To fill this gap, we have gathered a great and informative selection of infographical maps that they should’ve shown us at school: every single one of these maps reveals different fun and interesting facts, which can actually help you draw some pretty interesting conclusions. Show Full Text 167 years of the US age demographic in one chart We live in a world where people are living longer and the global demographic is changing. But what does this change actually look like? Reddit user Stephen Holzman wondered the same, and put together this visualization showing the US age distribution from 1933-2100. It offers a new way to understand an ageing population, putting into just a few seconds the long-term demographic changes going on around us. As Mr Holzman explained: “A lot gets written about the ‘greying’ of the population, but it’s difficult to be enthusiastic about a process that takes decades.
Earth at Night 2012 Account Options Sign in Earth at Night 2012 Big History Project Join us! The Big History Project is not a for-profit program. Your engagement will exclusively benefit teachers and students around the world. Teaching the course It's easy to teach Big History — all you have to do is register, set up a class, and go! Deaths registered in England and Wales - Office for National Statistics There were 529,655 deaths registered in England and Wales in 2015, an increase of 5.6% compared with 2014. Age-standardised mortality rates (ASMRs) increased in 2015 by 5.1% for females and 3.1% for males; a change to the general decrease in rates in recent years. In 2015, mortality rates for respiratory diseases (including flu) increased notably for both males and females. Cancer was the most common broad cause of death (28% of all deaths registered) followed by circulatory diseases, such as heart disease and strokes (26%). The infant mortality rate remained at 3.9 deaths per 1,000 live births in 2015. Back to table of contents
The Nighttime Earth SAN FRANCISCO — The Earth at night looks more beautiful than it ever has before in these incredible new images from NASA's Suomi NPP satellite. These super-high-resolution images, made possible by a new type of infrared sensor on the satellite, were revealed here at the American Geophysical Union conference Dec. 5.The Visible Infrared Imaging Radiometer Suite has a "day-night band" that can detect natural and man-made light with unprecedented resolution and clarity. It can resolve everything from the nocturnal glow of the atmosphere to the light of a single boat at sea.
The Shape of Life This relatively obscure series (2002) is a real find. 7 hour long episodes tell the story of primarily invertebrates of the sea (sponges, anemones, flatworms, molluscs, arthropods, jellyfish, sea stars, etc...) over the course of time and how we relate and in some cases depend on these seemingly lowly creatures. Amazing video footage and computer graphics clearly explain everything. The scope of the video is worldwide. This is documentary film-making at its best. It's a shame it's not more widely known because it is easily as good as (better than, IMHO) PBS/BBC documentaries on the same subject. America’s Shocking Maternal Deaths Photo The rate at which women die during pregnancy or shortly after childbirth has fallen sharply in many nations as maternal care has improved. The United States — and particularly Texas — is a glaring exception. In Texas, for instance, according to a study in the journal Obstetrics & Gynecology, the maternal mortality rate doubled from 17.7 per 100,000 live births in 2000 to 35.8 in 2014.
Global Views on Morality Do you personally believe that married people having an affair is morally acceptable, morally unacceptable, or is it not a moral issue? Do you personally believe that gambling is morally acceptable, morally unacceptable, or is it not a moral issue? Do you personally believe that homosexuality is morally acceptable, morally unacceptable, or is it not a moral issue? Do you personally believe that having an abortion is morally acceptable, morally unacceptable, or is it not a moral issue? Do you personally believe that sex between unmarried adults is morally acceptable, morally unacceptable, or is it not a moral issue?
World Population Clock This page will only work with a graphical browser implementing Javascript 3.0 or higher. It fairly accurately clocks the current population and reflects its growth using a second-order approximation of the exponential; in addition, if you enter a date in any form Javascript will accept and hit the "Do this time" button, it will use its magic formula to estimate the population for any date from 1900 to 2100, although the estimates become unreliable outside the range 1950 to 2050. Use the "Un/Freeze" button to "freeze" the clock at a certain time while it is ticking, or to resume it ticking with the present population after you have frozen it or asked for an estimate. Those familiar with the earlier version will note that the range in which the new version gives reasonable estimates has increased considerably.
Top 60 Chinese Cities Cities are one of the many phenomena that follow a long-tailed distribution. In simple terms there are a few big cities and lots of small ones. The classic way of showing a long tailed distribution (and the method from which the name is taken) is to produce as plot such as that below: The infographic at the top of the post by chinfographics.com demonstrates the distribution in a more engaging and constructive way. One method I have used in the past to demonstrate data with a long tailed distribution is the excellent Wordle tool. I have created a Wordle (below) for the same data (downloaded from Chinfographics). Scientix Works SHORTCUTS ⇒ e-BookEMINENTOnline debatesPamphletsPostersPress cornerpublicationsvideos 12 November 2015: Can teachers educate and inspire tomorrow’s innovators to foster skills for an innovative society?19 November 2015: The ideal science classroom/methodology for inspiring 11-14 year olds?2 December 2015: Collaboration in STEM education
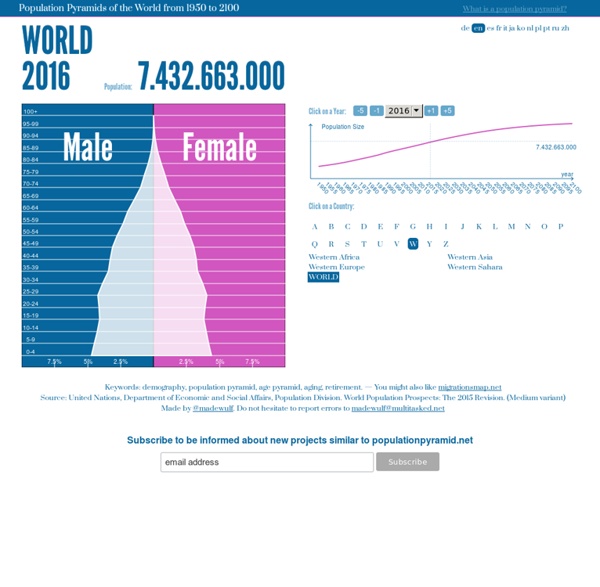
By 2060, this country will have the world's largest population In the 1950s the world looked very different. Data from the United Nations shows that the global population was around 2.5 billion. Today, that number is almost 7.5 billion and is expected to rise to 9.7 billion by 2050. In the middle of the 20th Century, China was home to 500 million people and, like today, it was the world’s the most populous nation, followed by India and the United States. But, based on current trends, the list of the world's most populous nations could look very different by 2060. If the Moon Were Only 1 Pixel - A tediously accurate map of the solar system Mercury Venus Earth You Are Here Moon Mars