background preloader

30 Templates & Vector Kits to Design Your Own Infographic

30 Templates & Vector Kits to Design Your Own Infographic
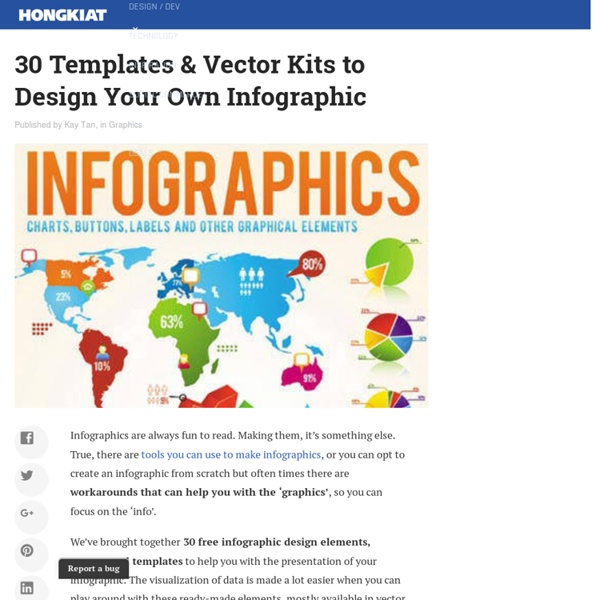
Infographics are always fun to read. Making them, it’s something else. True, there are tools you can use to make infographics, or you can opt to create an infographic from scratch but often times there are workarounds that can help you with the ‘graphics’, so you can focus on the ‘info’. We’ve brought together 30 free infographic design elements, vectors and templates to help you with the presentation of your infographic. The visualization of data is made a lot easier when you can play around with these ready-made elements, mostly available in vector and Photoshop format. These are great design kits for you to start fiddling around and build your own infographics. Recommended Reading: Data Visualization: 20+ Useful Tools And Resources Infographic banners. World Infographic. Information Technology infographic. Oil Theme Business Infographics. Year Infographic Elements. Elements of Food Infographic. Elements of Water Infographics Vector Set. Chart & Infographics Design Elements Vector 05.

Infographic Infographic template design 67,784 509 3 months ago Infographic template design 43,620 267 3 months ago Education infography in flat design 99,941 711 8 months ago Pack of four colorful infographic banners 71,244 311 4 months ago Round infographic template 255,594 1037 2 years ago New Blue round modern annual report template 10,417 65 2 weeks ago Abstract blue annual report brochure 2,379 18 2 weeks ago Yellow wavy modern annual report template 1,037 12 2 weeks ago Blue wavy annual report brochure 1,085 16 2 weeks ago Minimalist infographic with a timeline 84,148 524 9 months ago Infographic elements pack 221,054 894 2 years ago Business infographic with different steps 88,728 565 9 months ago Linear infographics with colored circles 15,022 141 2 months ago Infographic template design 19,362 178 3 months ago Colored infographic diagram 53,565 244 9 months ago Infography business stages 149,619 790 1 years ago Rounded infographic business 154,055 731 1 years ago Circular timeline 49,778 383 9 months ago

How To Create Outstanding Modern Infographics In this tutorial you will learn that data doesn't have to be boring, it can be beautiful! Learn how to use various graph tools, illustration techniques and typography to make an accurate and inspiring infographic in Adobe Illustrator. Start by using the Rectangle Tool (M) to draw a shape. The entire design is based on a grid of four columns. Condense the shape so it fits within the left-most guide and centre guide. Move the shape over to the right and add another guide to the centre here. Using the Rectangle Tool (M) draw a thin white box on the centre line that will be the width of the gap between the columns. Repeat the process for the other columns with your final result being below. I like to place the most important graphics first and work-in the ancillary charts and graphs afterwards. Early on you can experiment with placing a main graphic that will help give the piece some visual interest. Give the circles a variety of gradients. I'm using a variety of graphs in this infographic.

David Byrne's Hand-Drawn Pencil Diagrams of the Human Condition by Maria Popova “Science’s job is to map our ignorance.” David Byrne may have authored both one of last year’s best albums and best music books, but he is also one of the sharpest thinkers of our time and a kind of visual philosopher. About a decade ago, Byrne began making “mental maps of imaginary territory” in a little notebook based on self-directed instructions to draw anything from a Venn diagram about relationships to an evolutionary tree of pleasure — part Wendy MacNaughton, part Julian Hibbard, yet wholly unlike anything else. Möbius Structure of Relationships Writing in the introductory essay simply titled “Why? Maybe it was a sort of self-therapy that worked by allowing the hand to ‘say’ what the voice could not.Irrational logic — I’ve heard it called that. Social Information Flow Human Content Hidden Roots If you can draw a relationship, it can exist. The Legacy of Good Habits Morally Repugnant Gustatory Rainbow Imaginary Social Relationships Christian Subcultures Yes Means No

10 Of The Best Tools For Creating Infographics The invention of fire and the wheel – nice. But from the first cave paintings to the beginnings of logographs, and then of course the alphabet, human achievement has been tied closely with how we put our thoughts across. Come to think of it, we are still learning how to communicate. Twitter and Facebook are bringing in subtle lifestyle changes that future sociologists will put under the lens. The Wikipedia page captures the history of this visual science (or art) and tells us that infographics is by no means an invention of the digital culture. The only difference between then and now is the amount of information we are swamped with. But if you need more of a leg up, here are ten more tools that will help you get the visual message across with eyeball catching infographics. Visual.ly Visual.ly usually makes the top of any list that talk about infographic creation tools. The Process: Sign in and grant access using either your Twitter account or Facebook account. Noteworthy: Easel.ly Many Eyes

5 Tools For Creating Your Own Infographics Five years ago, almost nobody knew what the heck an infographic was. (I sure didn’t, and I was a graphic design major in college at the time.) Now that the infographic craze has saturated us with new visual knowledge (and marketing gimmicks), something interesting has happened: The creation of infographics has become democratized. No longer is the act of creating a visual data story confined to professional designers using professional tools like Adobe Illustrator or Photoshop. Now anyone with a data set can build an infographic. (See also 5 Business & Design Tools Every Tech Freelancer Should Learn.) Trust me when I say that with these tools, you don’t have to be a designer to create a high-quality, effective infographic. With that in mind, I’ve cobbled together a list of five services/methods that even non-designers can use to create or commission great infographics. Infogr.am: All The Bells And Whistles Infogr.am is free, and free is good. Piktochart: Drag-And-Drop Templates Galore

100+ Infographic Elements (Vector) Vector free Info-graphics including charts, maps, graphics, icons, timelines, layers and other data visual graphics. Infographics is about data visualization. It is a way to show your numbers in term of graphics, charts and other visual drawings. Make things clearer through this huge set of infographic elements. Dark Version Designers… This is pure illustrator file which means 100 vector elements. I think you will not find another free or even not free vector file as neat, clear and rich as this one. Note : To avoid scaling problems make sure your select all elements then go to Objects > Expand Appearence, also make sure you go Objects >Path > Outline Strokes if you want to scale strokes with your elements. Enjoy Enter your email address below and we'll send you the download link for this free file right to your inbox. Your email address is 100% safe from spam! Premium Version

Icon Archive - Search 418,049 free icons, desktop icons, download icons, social icons, xp icons, vista icons You're Distracted. This Professor Can Help. - Technology By Marc Parry Seattle Matthew Ryan Williams for The Chronicle Before each class session, David Levy leads his students in a few minutes of meditation. To complete her homework assignment, Meran Hill needed total concentration. The University of Washington senior shut the blinds in her studio apartment. Then she plunged into the task: Spend 15 minutes doing e-mail. Soon enough, though, a familiar craving bubbled up. As Ms. But the assignment had her trapped. The e-mail drill was one of numerous mind-training exercises in a unique class designed to raise students' awareness about how they use their digital tools. Their professor, David M. At its extreme, that debate plays out in the writing of authors whom the critic Adam Gopnik has dubbed the Never-Betters and the Better-Nevers. On college campuses, meanwhile, educators struggle to manage what the Stanford University multitasking researcher Clifford Nass describes as a radical shift in the nature of attention. When I ask Mr. But Mr. Mr.

How to Create Good Infographics Quickly & Cheaply | SEW Everyone is building infographics, why not me? I actually asked myself this question the other day, and my initial answer was, "Because I have absolutely no graphic design ability at all." Well, honestly that answer kind of pissed me off. I'm a smart girl, I can figure this out without paying a fortune, right? Who Cares About Your Infographic? Now, no infographic post is complete without the requisite section where we talk about the "Who Cares?" Is your Idea going to be too long? Create your ideas and content with these questions in mind. The Search for an Infographic Solution My search began for a web-based program that can help me. Free or nearly freeNo annual commitmentsWeb basedEasy to use, drag and drop, and no Photoshop required I found a few that fit the criteria, and tried them out. Google Docs After doing some queries, I found that you can build a simple infographic with Google Docs. Easel.ly Easel.ly is in beta, and registration is free. Infogr.am Piktochart.com Paid Solutions Summary

Related: