
Mechanical Turk Workflow with MTurkR. I’ve been using Thomas Leeper‘s MTurkR package to administer my most recent Mechanical Turk study—an extension of work on representative-constituent communication claiming credit for pork benefits, with Justin Grimmer and Sean Westwood.
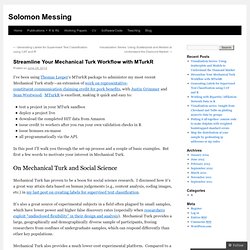
MTurkR is excellent, making it quick and easy to: test a project in your MTurk sandboxdeploy a project livedownload the completed HIT data from Amazonissue credit to workers after you run your own validation checks in Rissue bonuses en-masseall programmatically via the API. In this post I’ll walk you through the set-up process and a couple of basic examples. But first a few words to motivate your interest in Mechanical Turk. On Mechanical Turk and Social Science. Programming a Twitter bot in R. A considerable share of Twitter accounts is not actually run by humans.
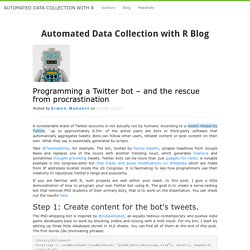
According to a recent release by Twitter, `up to approximately 8.5%' of the active users are bots or third-party software that automatically aggregates tweets. Bots can follow other users, retweet content or post content on their own. What they say is essentially generated by scripts. Take @TwoHeadlines, for example. The bot, hosted by Darius Kazemi, scrapes headlines from Google News and replaces one of the nouns with another trending noun, which generates hilarious and sometimes thought-provoking tweets. If you are familiar with R, such projects are well within your reach. Step 1: Create content for the bot's tweets.
The PhD whipping bot is inspired by @indiewhipbot, an equally tedious contemporary who pushes indie game developers back to work by shouting orders and closing with a mild insult. Dave Harris on Max Like Est. At our last Davis R Users’ Group meeting of the quarter, Dave Harris gave a talk on how to use the bbmle package to fit mechanistic models to ecological data.
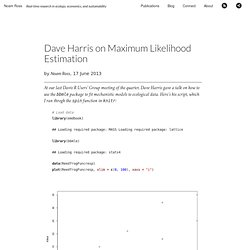
Here’s his script, which I ran throgh the spin function in knitr: Poor man’s integration – a simulated visualization approach – R is my friend. Every once in a while I encounter a problem that requires the use of calculus.
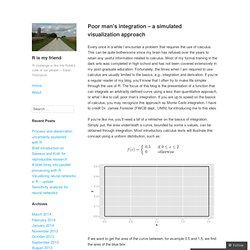
This can be quite bothersome since my brain has refused over the years to retain any useful information related to calculus. Most of my formal training in the dark arts was completed in high school and has not been covered extensively in my post-graduate education. Fortunately, the times when I am required to use calculus are usually limited to the basics, e.g., integration and derivation. Parameter Fitting for Models Involving Differential Equations. It looks like MATLAB, Octave and Python seem to be the preferred tools for scientific and engineering analysis (especially those involving physical models with differential equations).
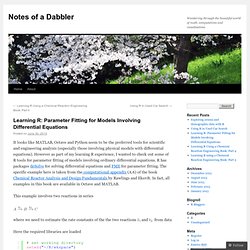
However as part of my learning R experience, I wanted to check out some of R tools for parameter fitting of models involving ordinary differential equations. SIR Model - The Flu Season - Dynamic Programming. # The SIR Model (susceptible, infected, and recovered) model is a common and useful tool in epidemiological modelling. # In this post and in future posts I hope to explore how this basic model can be enriched by including different population groups or disease vectors. # Simulation Population Parameters: # Proportion Susceptible Sp = .9 # Proportion Infected Ip = .1 # Population N = 1000 # Number of periods r = 200 # Number of pieces in each time period. # A dynamic model can be simulated by dividing each dynamic period into a sufficient number of discrete pieces. # As the number of pieces approaches infinity then the differences between the simulated outcome and the outcome achieved by solving the dynamic equations approaches zero. np = 1 # Model Parameters: # Transmition rate from contact with an infected individual.
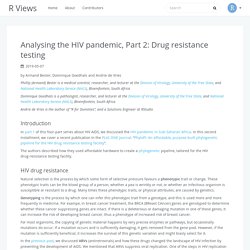
. # Initial populations: # Sesceptible population, Sv is a vector while S is the population values as the current period Sv = S = Sp*N # Initial immunity. Analysing the HIV pandemic, Part 1: HIV in sub-Sahara Africa. Analysing the HIV pandemic, Part 2: Drug resistance testing. By Armand Bester, Dominique Goedhals and Andrie de Vries Phillip (Armand) Bester is a medical scientist, researcher, and lecturer at the Division of Virology, University of the Free State, and National Health Laboratory Service (NHLS), Bloemfontein, South Africa Dominique Goedhals is a pathologist, researcher, and lecturer at the Division of Virology, University of the Free State, and National Health Laboratory Service (NHLS), Bloemfontein, South Africa.
Analysing the HIV pandemic, Part 3: Genetic diversity. By Armand Bester and Andrie de Vries Phillip (Armand) Bester is a medical scientist, researcher, and lecturer at the Division of Virology, University of the Free State, and National Health Laboratory Service (NHLS), Bloemfontein, South Africa Andrie de Vries is the author of “R for Dummies” and a Solutions Engineer at RStudio Recap In part 2 of this series, we discussed the PhyloPi pipeline for conducting routine HIV phylogenetics in the drug-resistance testing laboratory as a part of quality control.
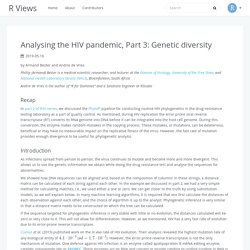
As mentioned, during HIV replication the error-prone viral reverse transcriptase (RT) converts its RNA genome into DNA before it can be integrated into the host cell genome. Introduction As infections spread from person to person, the virus continues to mutate and become more and more divergent. Analysing the HIV pandemic, Part 4: Classification of lab samples. Gmapsdistance.