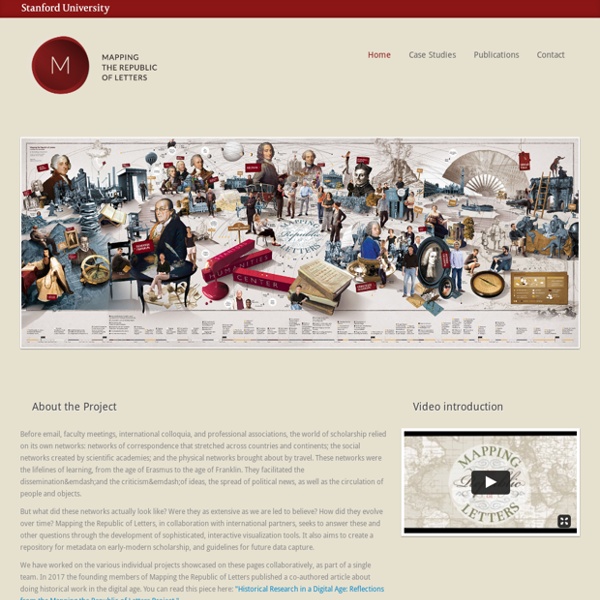


http://republicofletters.stanford.edu/
Related: à reclasser 01Facebook Tackles (Really) Big Data With 'Project Prism' Today, countless websites are facing the epic amounts of online data that first hit Facebook a half decade ago. But according to Facebook engineering bigwig Jay Parikh, these sites have it so much easier. That’s because many of the web’s largest operations — including Facebook — spent the last few years building massive software platforms capable of juggling online information across tens of thousands of servers. Visualization as a Digital Humanities ________ Presentation given on Saturday, April 27, 2013, at HASTAC 2013 in Toronto, Canada. [Download on Slideshare] You will notice I have changed the title of my presentation a bit from what is in the program. Partially, it’s because I’m an indecisive academic, but mostly, it is in reaction to my experience of co-hosting a HASTAC forum on “Visualization Across Disciplines” this past week.
manifeste flamandisation (Maeterlinck) Un article de Wikipédia, l'encyclopédie libre. Maurice Maeterlinck Maurice Polydore Marie Bernard Maeterlinck (/ma.tɛʁ.lɛ̃ːk/ en Belgique ; /mɛ.teʁ.lɛ̃ːk/ en France[1]), né le 29 août 1862 à Gand (Belgique) et mort le 6 mai 1949 à Nice (France), est un écrivain francophone belge, prix Nobel de littérature en 1911. Articles table of contents methods All images in this article were created with Circos (v0.49) and the tableviewer utility tool.
chorobot in time machine Good old Bullets, just from their song "Somewhere in between" from Les Miserables I knew they were an unstoppable hit machine. That instant pop classic must have caught the attention of Jim Terry 'cause here they are singing the theme tune to Time Fighters. And it's not the last time we hear an original composition from them but more on that later. Our story begins in the laboratory of Professor Von Spock as the final preparations are being made to his new time machine Scorpion 2 (the narrator states that there never was a Scorpion 1 since the inventor didn't want to waste the time, with more than a little derision in his voice).
Digital Humanities Toolkit vida quantofrenica (vie dite 2.0) vivagora , le 21 Août 2012 dans Nos actions vivagora L' et avec leurs partenaires ... organisent le Methods and protocols in molecular biology - GFP Applications Page designed by Wallace Marshall, Yale University. {*style:<b>Added: 28-Nov-1999 Hits: 982 Rating: 7.33 Votes: 3 [ Rate It ] </b>*} - Contains many molecular biology protocols as well as some Drosophila protocols. Buddha crime Buddhism and the problem of crime By Bandula Jayawardhana Formerly Editor in-Chief Encyclopaedia of Buddhism "CRIME" is a word we use today to denote any offence against a community as a whole, or one (or more) of its members. At the same time implicit in our use of it, is the sense that it is punishable, or deserving of punishment by a socially-recognised authority. The traditional literature of Buddhism does not seem to possess a word which identically fits our meaning, idle and futile as it is to seek for an equivalent in a religious system with its own highly specialized terminology and its own historical and geographical background.
Buddhism in the Numbers BUDDHISM IN THE NUMBERS Rev. Jnana - Zen Dharma Teacher - IBMC A Dharma Talk at the IBMC --- The rather inelegant title of today’s talk, “Buddhism in the Numbers”, does an injustice to the elegance of the subject itself, the role of numbers in communicating the dharma. For there is indeed a rich vein of numerical references in Buddhism, primarily in the sutras, but also in related doctrines and teachings. My purpose here this morning is to briefly mine that vein, to bring a greater degree of awareness to the place of numbers that permeate so much of our study and devotion along the Buddhist path.
girl swept into dream Photographer Beata Cervin, who is based in Stockholm, Sweden, takes an ethereal approach to her body of work labeled Magic. The light and airy aesthetic has the appeal of a sun-soaked fairy tale—bright and dreamy. There's a girlish charm about her photos that seems to not only refresh one's senses but captivate one's imagination. Rather than taking her photography into the depths of the land of the surreal, where there is no sense of direction and nothing is easily translated, Cervin adds hints of oddities, often in the form of light and gravity-defiance. The inexplicable levitating bodies that appear in the photographer's portfolio seem to weightlessly float in the air.
Why do we believe in electrons, but not in fairies? by Benjamin Kuipers No one has directly observed either electrons or fairies. Both of them are theoretical constructs, useful to explain observations that might be difficult to explain otherwise. The "theory of fairies" can actually explain more things than the "theory of electrons". So why do we believe in electrons, but not in fairies?
A Case Study in Voodoo Genetics A new review of published studies looking at the relationship between a gene and brain structure offers a sobering lesson in how science goes wrong. Dutch neuroscientists Marc Molendijk and colleagues took all of the studies that compared a particular variant, BDNF val66met, and the volume of the human hippocampus. It's a long story, but there are various biological reasons that these two things might be correlated. It turns out that the first published reports found large genetic effects, but that ever since then, the size of the effects has dropped, with the latest studies finding no effects at all - A cumulative meta-analysis confirms that as more studies on BDNF val66met have appeared, the overall effect estimate has steadily declined -