Climate Data Online (CDO) - The National Climatic Data Center's (NCDC) Climate Data Online (CDO) provides free access to NCDC's archive of historical weather and climate data in addition to station history information. National Oceanic and Atmospheric Administration. NRCS National Water and Climate Center. Table of Contents Atlas of Oregon Climate and Climate Change. Earth. GCSE Geography; Weather and Climate. The Mountain Problem. Air, Moisture and Mountains The temperature of a mass of air determines how much moisture content it can hold.
Warmer air can hold more moisture than cooler air, so air masses that are very cold hold little or no moisture content. Masses of air are categorized by where they originate, and where they originate determines their relative temperature and their moisture content. Air masses that form over water are heavily saturated since they typically form over oceans where water is abundant and are usually referred to as maritime air masses. Dry air masses commonly form over large continental areas where the lack of water at the surface results in the relatively arid air mass known as a continental air mass. Understanding ENSO. Daily Summaries Station Details: BLAZED ALDER, OR US, GHCND:USS0021D33S. Daily Summaries Station Details: RED HILL, OR US, GHCND:USS0021D04S. Daily Summaries Station Details: MOUNT HOOD TEST SITE, OR US, GHCND:USS0021D08S. Daily Summaries Station Details: GOVERNMENT CAMP, OR US, GHCND:USC00353402.
Daily Summaries Station Details: MUD RIDGE, OR US, GHCND:USS0021D35S. MIMIC-TPW2. Office of Washington State Climatologist: The Storm King - Some Historical Weather Events in the Pacific Northwest. Earthdata Login. OWSC: Climate Events. Office of Washington State Climatologist: The Storm King - Some Historical Weather Events in the Pacific Northwest.
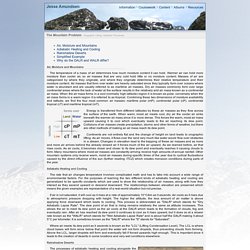
USGS Flood History. Extreme Events – Center for Western Weather and Water Extremes. Meteorological Conditions Associated with the Deadly 9 January 2018 Debris Flow on the Thomas Fire Burn Area Impacting Montecito, CA: A Preliminary Analysis January 16, 2018 Nina Oakley1, 2, 3 and Marty Ralph3 1 Western Regional Climate Center, Desert Research Institute, Reno, NV 2 California-Nevada Applications Program, a NOAA RISA Team 3 Center for Western Weather and Water Extremes at Scripps Institution of Oceanography Summary A period of very intense rainfall associated with a Narrow Cold Frontal Rainband (NCFR) appears to be the primary meteorological trigger for the deadly and destructive post-fire debris flow in and below the Thomas Fire burn area.When a watershed experiences sufficient burn severity during a wildfire, water repellent soils can develop.
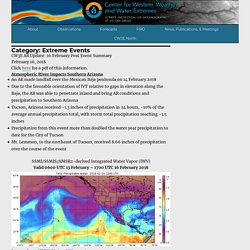
Figure 1 shows the likelihood of debris flow occurrence with a design storm for the Thomas Fire. Figure 2: Looking towards burn area in Montecito. As of 15 January 2018, reports indicated 20 deaths, and more remained unaccounted for. Remote Sensing Systems. What is Water Vapor?
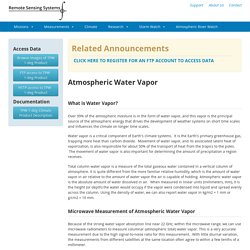
Over 99% of the atmospheric moisture is in the form of water vapor, and this vapor is the principal source of the atmospheric energy that drives the development of weather systems on short time scales and influences the climate on longer time scales. Water vapor is a critical component of Earth's climate systems. It is the Earth's primary greenhouse gas, trapping more heat than carbon dioxide.
The Christmas Flood of 1964. Release Date: The Christmas flood of 1964 encompassed about 200,000 square miles, or roughly the size of France, resulted in 47 deaths, left thousands homeless and caused more than $540 million ($3.9 billion today) worth of damage.
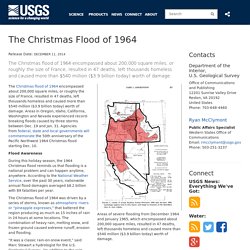
Areas of severe flooding from December 1964 and January 1965, which encompassed about 200,000 square miles, resulted in 47 deaths, left thousands homeless and caused more than $540 million ($3.9 billion today) worth of damage. The Christmas flood of 1964 encompassed about 200,000 square miles, or roughly the size of France, resulted in 47 deaths, left thousands homeless and caused more than $540 million ($3.9 billion today) worth of damage.
Areas in Oregon, Idaho, California, Washington and Nevada experienced record-breaking floods caused by three storms between Dec. 19 and Jan. 31. Agencies from federal, state and local governments will commemorate the 50th anniversary of the Pacific Northwest 1964 Christmas flood starting Dec. 10. Chapter 11 Notes - Wind: Global Systems - Survey of Meteorology at Lyndon State College. Downloads - Climate Science Special Report. Videogateway. East Pacific Region MIMIC TPW. Atmospheric Rivers – Center for Western Weather and Water Extremes. Atmospheric River Reconnaissance – 2018 is Underway February 8, 2018 Beginning on January 19th with a dry run for forecast and flight planning operations, CW3E director Marty Ralph has been leading the Atmospheric River Reconnaissance (AR Recon; 2018 campaign, in close collaboration with Co-PI Vijay Tallapragada of the National Center for Environmental Prediction (NCEP) and Jim Doyle of the Naval Research Laboratory (NRL).
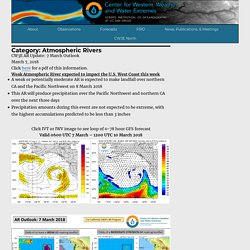
AR Recon 2018 supports improved prediction of landfalling atmospheric rivers on the US west coast, which is a type of storm that is key to the region’s precipitation, flooding and water supply (e.g., Ralph et al. 2012, 2013, 2016; Dettinger et al. 2011; Neiman et al. 2011). Forecasts of landfalling ARs are key to precipitation prediction and yet are in error by +/- 400 km at even just 3-days lead time (Wick et al., 2013). Key sponsors are the U.S. Fig. 1. Fig. 2. Lamberson Butte Topo Map in Hood River County, Oregon. Florida jupiter climate koppen. Climate Variability - Florida Climate Center. Climate Versus Weather Climate is the long-term (monthly or longer) pattern of weather conditions in a region.
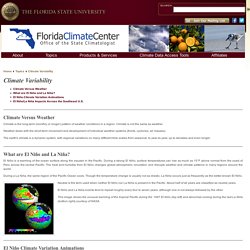
Climate is not the same as weather. Weather deals with the short-term movement and development of individual weather systems (fronts, cyclones, air masses). The earth's climate is a dynamic system, with regional variations on many different time scales from seasonal, to year-to-year, up to decades and even longer. Tropical Cyclone Climatology. Contents Overview A tropical cyclone is a rotating, organized system of clouds and thunderstorms that originates over tropical or subtropical waters and has a closed low-level circulation.
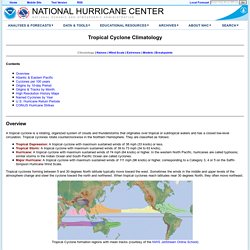
Tropical cyclones rotate counterclockwise in the Northern Hemisphere. They are classified as follows: Tropical Depression: A tropical cyclone with maximum sustained winds of 38 mph (33 knots) or less.Tropical Storm: A tropical cyclone with maximum sustained winds of 39 to 73 mph (34 to 63 knots).Hurricane: A tropical cyclone with maximum sustained winds of 74 mph (64 knots) or higher. Tropical cyclones forming between 5 and 30 degrees North latitude typically move toward the west.
Climographs for Selected U.S. Cities. Why is Eastern North America so cold and the globe so hot? Why is Eastern North America so cold and the globe so hot?
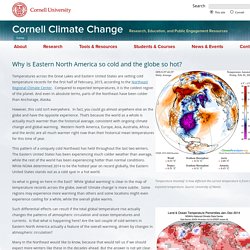
‘Temperature Anomaly’ is how different the current temperature is from the expected temperature. Source: University of Maine. Temperatures across the Great Lakes and Eastern United States are setting cold temperature records for the first half of February, 2015, according to the Northeast Regional Climate Center. Compared to expected temperatures, it is the coldest region of the planet. And even in absolute terms, parts of the Northeast have been colder than Anchorage, Alaska. However, this cold isn’t everywhere.
This pattern of a uniquely cold Northeast has held throughout the last two winters. What is the Gulf Stream? The Gulf Stream is a powerful current in the Atlantic Ocean.
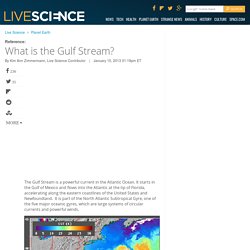
It starts in the Gulf of Mexico and flows into the Atlantic at the tip of Florida, accelerating along the eastern coastlines of the United States and Newfoundland. It is part of the North Atlantic Subtropical Gyre, one of the five major oceanic gyres, which are large systems of circular currents and powerful winds. The Gulf Stream is a western boundary current; its behavior is determined by the North American coastline. Trade winds from Africa drive water in the Atlantic westward until it hits the coastline and gets pushed northward. The Gulf Stream: Weather and Climate Effects. The Gulf Stream is more than just a single current that attracts an exotic range of fish, and provides quick shortcuts to traveling ships.
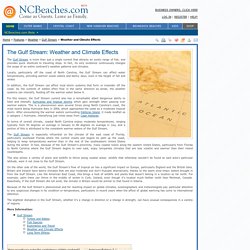
In fact, its very existence continuously changes the scope of an entire continent's weather patterns and climates. UCSB Science Line. North America. 4.1 Introducing the Realm Learning Objectives Define the physiographic regions of North America. Climate Education Modules for K-12. The Pacific/North American Pattern, or PNA, describes the variation of atmospheric circulation patterns over the Pacific Ocean and North America.
Like other atmospheric circulations, the PNA has the most impact on climate variables during the winter. There are two phases of the PNA, a positive phase and a negative phase. The positive phase usually relates to El Niño and the negative phase to La Niña, however there is a weak connection between the PNA and ENSO. Index. General atmospheric circulation. The cold front of this mid latitude cyclone spawned several fatal tornados on April 28, 2011. The cold front is the blue line with triangles pointing toward the east. Image via NOAA HPC. Climate Education Modules for K-12. PNA. PNA = 0,25 x [Z (20°N, 160°W) - Z (45°N, 165°W) + Z (55°N, 115°W) - Z (30°N, 85°W)] where Z names the average of the anomaly of each month following the basis period of 1950-2000 500 hPa geopotential.
Cloud History, Cloud Thinking — Cloud Index — James Bridle. Microclimate - Climate, Microclimates, Climates, and Altered. 09 2 01 9 Chapter 4 Ecosystems Climate and Fuels. Macro, Meso, and Micro: Finger Lakes Climate - Sheldrake Point Winery Sheldrake Point Winery. Climate Classifications October 28, Weather vs. Climate Weather – state of the atmosphere at a specific place and time on Earth’s surface. Climate. - ppt download. Part 6. Current, Past, and Future Climates - ppt download. U.S. Koppen-Geiger climate classification (2000 - 2100) Interactive United States Koppen-Geiger Climate Classification Map. Koppen climate classification. Köppen climate classification, widely used, vegetation-based empirical climate classification system developed by German botanist-climatologist Wladimir Köppen.
His aim was to devise formulas that would define climatic boundaries in such a way as to correspond to those of the vegetation zones (biomes) that were being mapped for the first time during his lifetime. User:Me ne frego. From Wikimedia Commons, the free media repository. Chapter 11. Weather & Climate. Climate classification. Types of Communities - Community Interactions - EVOLUTION AND ECOLOGY - CONCEPTS IN BIOLOGY. 16. Community Interactions 16.4. Physical Geography. Chapter 7: Introduction to the Atmosphere. 7(o) Local and Regional Wind Systems. Thermal Circulations As discussed earlier, winds blow because of differences in atmospheric pressure. Category:Köppen climate classification maps of states of the United States. Local Wind Patterns. GROLIER ONLINE ATLAS.
Chapter 7: Introduction to the Atmosphere. The Geophile Pages. AL@Latitude: Equator. Chapter 2: Weather and Climate Introduction to Geography. - ppt download. Cultural Geography GEOG 101 Dr. Scott S. Brown. - ppt download. Climates of the Earth Climates of the World. - ppt download. AS Level Geography - Ann Bowen, John Pallister - Google Books. Fundamentals of Physical Geography - David John Briggs, Peter Smithson - Google Books. Factors Controlling Climate. Climate Controls. Us geography. Moisture Clouds and Precipitation « KaiserScience. Moisture Clouds and Precipitation « KaiserScience. Moisture Clouds and Precipitation « KaiserScience. CHAPTER 4. ATMOSPHERIC TRANSPORT. Alan Betts: Atmospheric Researcher — Understanding Climate Change Question.
Dew Point Calculator. Atmosphere. Ozone Chapter 2. Temperature Patterns. Advanced Answers. Intermediate Answers. Chapter 2 Section 4. Climate Education Modules for K-12. Chapter 3 Notes-Temperature. Chapter 10. 3. Temperature. North and South Poles: Important Climate Differences. Index. Effects of Cloud Cover: on forecasted temperatures. Ch 12 Climate Systems and Change - Open Geography Education. CLIMATE OF WASHINGTON. GCSE Bitesize: Factors affecting climate.
Air Temperature Topic Outline. Explaining Patterns: Air Temperature. The weather 1º ESO.