
Kansas Weather Page. Premium Weather Maps. Copyright © 2015 WeatherBELL Analytics LLC Contact Us: WeatherBELL Analytics New York City Subscriber agrees that the Site and its services are furnished and shall be used solely for Subscriber's personal, business or institutional use, and is subject to our Acceptable Use Policy.
Subscriber shall not have the right to directly or indirectly transmit, broadcast, redistribute, forward or deliver the Products or services or any part of the data, information, images or other products which constitute the Site, Products and/or services to any other person or entity, in any format (including, but not limited to framing, deep liking or embedding), or by any means. Storm Prediction Center - ENSO Strength and Tornadoes. The charts below illustrate that occasional weak cool-season links may occur between the phase strength of the El Niño Southern Oscillation (ENSO phase strength) and EF1 to EF5 tornado reports for bi-monthly periods from 1950 through 2010 (1951 to 2011 for the last pair, Dec-Jan period).
The charts display a simple running sum of EF1 to EF5 tornado events over the same bi-monthly periods that are used for the Multi-variate ENSO Index, or MEI, (Wolter, K., and M. S. Timlin, 1998). The bi-monthly charts on the left show tornado events summed for each period with the years increasing along the positive y-axis. CR Tech Service Paper 10 Severe Weather Stability Indices. Instability is a critical factor in severe weather development.
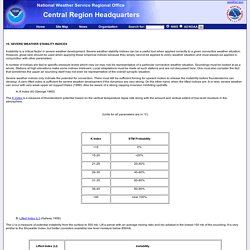
Severe weather stability indices can be a useful tool when applied correctly to a given convective weather situation. However, great care should be used when applying these empirical indices because they simply cannot be applied to every weather situation and must always be applied in conjunction with other parameters. A number of indices are tied to specific pressure levels which may (or may not) be representative of a particular convective weather situation. Soundings must be looked at as a whole. Stations at high elevations make some indices irrelevant. Severe weather indices only indicate the potential for convection. A. Weather Related Converters and Calculators. Sfcoa. Rich Thompson - Storm Prediction Center The SPC utilizes all available surface observations, in combination with short-term forecasts from the Rapid Refresh (RAP) model, to generate hourly mesoscale analyses of various parameters related to severe thunderstorms and tornadoes.
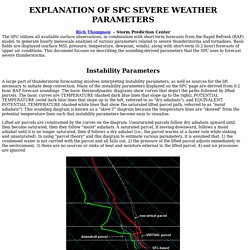
Basic fields are displayed (surface MSL pressure, temperature, dewpoint, winds), along with short-term (0-2 hour) forecasts of upper air conditions. This document focuses on describing the sounding-derived parameters that the SPC uses to forecast severe thunderstorms. Instability Parameters A large part of thunderstorm forecasting involves interpreting instability parameters, as well as sources for the lift necessary to initiate deep convection.
Lifted air parcels are constrained by the curves on the diagram. The SPC uses two different methods to calculate instability parameters - "virtual" parcels, and "non-virtual" parcels. For additional information, please see: Doswell, C.A., III, and E.N. Craven, J. Tornado Potential. Tornado Potential Being reasonably confident that supercell thunderstorms were likely in south central Oklahoma, SPC forecasters turned their attention to the potential for tornadoes.
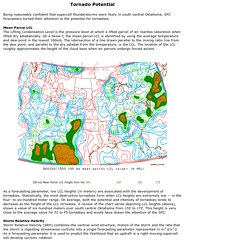
Mean Parcel LCL The Lifting Condensation Level is the pressure level at which a lifted parcel of air reaches saturation when lifted dry adiabatically. On a Skew-T, the mean parcel LCL is identified by using the average temperature and dew point in the lowest 100mb. DeterminingLCL.pdf. NWS Louisville: Convective Parameters and Indices. Evaluation of Stability Lapse rate: Refers to the rate of temperature change with height in the atmosphere.
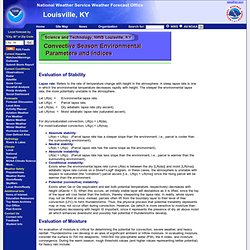
A steep lapse rate is one in which the environmental temperature decreases rapidly with height. The steeper the environmental lapse rate, the more potentially unstable is the atmosphere. Lcl.pdf. Ingredients supporting tornado events involving mini supercells or low topped storms. Ingredients supporting tornado events associated with closed 500 mb cold core lows (summary by Jon Davies) ( Some case studies : 10 April 2005 in northwest Kansas 7 July 2004 in northern Kansas 18 April 2003 in central Nebraska ) Weather settings with potential for tornadoes near closed 500 mb cold core lows are often difficult to diagnose using "accepted" supercell tornado parameters, which is why they will be summarized separately here.
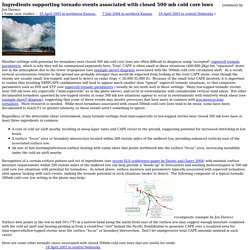
Total CAPE is often small in these situations (400-800 J/kg) but "squeezed" down low in the atmosphere due to the lower tropopause (see example skewT diagram) associated with the 500mb cold core circulation aloft. As a result, vertical accelerations relative to the ground are probably stronger than would be expected from looking at the total CAPE alone, even though the storms are usually small, low-topped, and hard to detect on radar (tops < 30,000-35,000 ft). Probability Forecasting. 1.
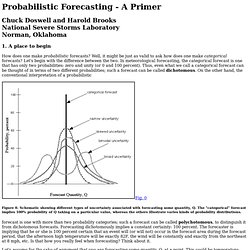
A place to begin. How Do You Spot a Tornado Using Weather Radar? I could swear you had a very similar article a few weeks ago in which you presented much the same information, before the recent tornadoes.
Did I just dream it? It's still good info, but I feel some déjà vu. You'd be right. Last month I wrote a piece about the aforementioned tornado in Mississippi, and how NWS meteorologists used dual-pol data to confirm that it was on the ground and doing damage. In that post, I focused on dual-pol and briefly mentioned velocity products. Yes! The Online Tornado FAQ (by Roger Edwards, SPC) Background photo courtesy NSSL.
Last modified 7 Mar 2014 This list of Frequently Asked Questions (FAQ) has been compiled from questions asked of the SPC as well as basic tornado research information and countless scientific resources. More material will be added, time permitting. If you find a link not working or an error of any sort, please e-mail the FAQ author. The Tornado FAQ is not intended to be a comprehensive guide to tornadoes. Tornado History Project: Maps and Statistics.
The Tornado Project. Storm Data Publication. National Climatic Data Center. SPC Historical Severe Weather Database Browser (SeverePlot 3.0) SPC Historical Severe Weather Database Browser (SeverePlot 3.0) Storm Prediction Center - ENSO Strength and Tornadoes. Storm Prediction Center WCM Page. NWS Louisville: Convective Parameters and Indices. Current Marine Data. Lightning: Fact, Myths and Misnomers. Tornado Climatology of the Southeast U.S.