
The 2021 Kearney Foreign Direct Investment Confidence Index®: On shaky ground - Kearney. The Kearney FDI Confidence Index® is an annual survey of global business executives that ranks the markets likely to attract the most investment in the next three years.
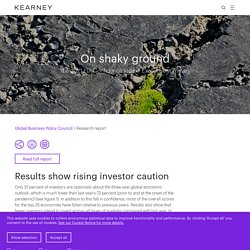
The first report was released in 1998. Click here for past editions. FEMA National Risk Index (NRI) - Identifies Communities Most at Risk to 18 Natural Hazards. The National Risk Index is a new, online mapping application from FEMA that identifies communities most at risk to 18 natural hazards.
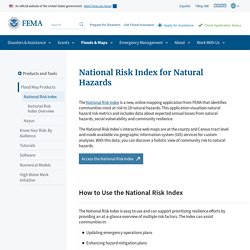
This application visualizes natural hazard risk metrics and includes data about expected annual losses, social vulnerabilities and community resilience. The National Risk Index's interactive web maps are at the county and census tract level and made available via geographic information system (GIS) feature services for custom analyses. With this data, you can discover a holistic view of community risk to natural hazards via online maps and data. Global Connectedness Index - DHL. Global Cities Index: New Priorities for a New World - Kearney. Depending on where you are in the world, we’re now anywhere from six months to almost a year into the COVID-19 pandemic, and the cities included in the 2020 GCI and GCO are at various stages of response and recovery.
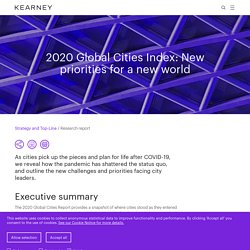
As they have begun to emerge from the depths of the crisis, the future of cities has become the subject of intense debate. Indeed, with pundits feverishly suggesting that the pandemic is “killing the attraction of megacities” and that they are “losing their allure,” many have begun to question whether the city can survive as a primary locus of economic and social activity. While these reactions are extreme, so too are the impacts global cities have already witnessed. Emptied city centers There’s no denying that many cities are much quieter places than before.
FM Global Resilience Index – Compare Risk in 130 Countries to Evaluate Regions, Site Business operations, and Select Partners. The resilience of a country's business environment matters when you're planning where to do business.
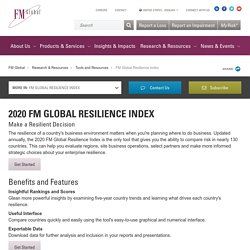
Updated annually, the 2020 FM Global Resilience Index is the only tool that gives you the ability to compare risk in nearly 130 countries. This can help you evaluate regions, site business operations, select partners and make more informed strategic choices about your enterprise resilience. Get Started Benefits and Features. Commitment to Development Index - Measures How Effectively Countries Support Development in Other Countries. WEF Global Competitiveness Index. WTO Trade Statistics - Trends in World Trade - Products and Services. Fragile States Index - Risk and Vulnerability in 178 Countries. Agility Emerging Markets Logistics Index. Metabiota Epidemic Tracker. WEF Global Gender Gap Report 2020 - Benchmarks National Gender Gaps on Economic, Education, Health and Political Criteria.
The Global Gender Gap Index was first introduced by the World Economic Forum in 2006 as a framework for capturing the magnitude of gender-based disparities and tracking their progress over time.
The index benchmarks national gender gaps on economic, education, health and political criteria (see Figure 1), and provides country rankings that allow for effective comparisons across regions and income groups. The rankings are designed to create global awareness of the challenges posed by gender gaps and the opportunities created by reducing them. The methodology and quantitative analysis behind the rankings are intended to serve as a basis for designing effective measures for reducing gender gaps. This year’s 14th edition continues to build on the well-established methodology. This chapter presents the 2020 rankings, trends in both overall scores and subindex scores, as well as performances across regions. The 2020 Capacity to Combat Corruption Index. COVID-19 is posing unprecedented challenges to Latin America, including its efforts to combat corruption.
All countries in the region have been forced to swiftly mobilize massive resources to fight the virus and to mitigate its economic fallout. In this environment of emergency spending, relaxed controls, and remote working, the risk of corruption and mismanagement of funds has increased. Video: The 2020 CCC Index Launch Against this backdrop, AS/COA and Control Risks are launching the second edition of the Capacity to Combat Corruption (CCC) Index.
The index was launched in 2019 to assess Latin American countries’ ability to uncover, punish, and prevent corruption. Social Progress Imperative - Social Progress Index. The Social Progress Index offers a rich framework for measuring the multiple dimensions of social progress, benchmarking success, and catalyzing greater human wellbeing.
Social progress globally This year’s Social Progress Index again reveals striking differences between countries in their overall social performance, and in their performance across different components of social progress. The Social Progress Index score is an average across scores for the three broad dimensions: Basic Human Needs, Foundations of Wellbeing, and Opportunity. Social progress index results. ND-GAIN Country Index - Summarizes a Country's Vulnerability to Climate Change. INFORM - Global, open-source risk assessment for humanitarian crises and disasters. OECD Social Institutions and Gender Index (SIGI) - Measures Discrimination Against Women in Social Institutions Across 180 Countries.
Yale Center for Environmental Law & Policy. The Environmental Performance Index (EPI) ranks 180 countries on 32 performance indicators across 11 issue categories covering environmental health and ecosystem vitality.
The 2020 EPI features new metrics that gauge waste management, carbon dioxide emissions from land cover change, and black carbon emissions – all important drivers of climate change. Below is a selection of news coverage of this year’s EPI release. For more information and to view complete coverage, go to the EPI website at epi.yale.edu. What Does Sustainability Look Like? New Global Scorecard Will Offer a Glimpse. Everest Group COVID-19 Dynamic Tracker - Tracks How COVID-19 is Affecting Leading Offshore and Nearshore Locations.
Quality of Nationality Index. WEF Global Social Mobility Index. International Intellectual Property Index. FutureBrand Country Index - Measures the Strength of Perception of Countries. The Global Energy Innovation Index: National Contributions to the Global Clean Energy Innovation System. Since 2015, 24 nations and the EU have joined “Mission Innovation,” pledging to double public investments in energy RD&D and collaborate on key innovation challenges.

This report seeks to provide accountability for these commitments and lay the foundation for more ambitious measures. To sustain global prosperity and expand energy access while meeting the challenge of climate change, energy must become more reliable, more affordable, and cleaner. Fossil fuel combustion, the primary source of climate-warming emissions, still supplies about 80 percent of global energy needs—and total consumption is rising. These emissions must either be captured or eliminated in the coming years if the worst consequences of climate change are to be averted.
If dramatic emissions cuts cannot be achieved without raising energy costs or degrading performance, the energy transition will fall short. Energy innovation is a global process. MI was a bold declaration. Marketplace Expansion Index. Global Cybersecurity Index. United Nations E-Government Development Index. European Economic Indicators - EUROSTAT. Government AI Readiness Index — Oxford Insights. The Government AI Readiness Index is a quantitative toolkit designed to provide an overview of any government’s readiness to use AI.
The Index incorporates a wide range of data, from desk research on the presence of AI strategies, to Crunchbase statistics on AI startups, to UN indices, and distills it into a single number. This facilitates global comparisons, as well as the ability to track a government’s progress in this area over time. Like all indexes, however, it does not capture the full complexity of the picture on the ground.
Ghana’s relatively low score, for example, does not acknowledge developments such as Google recently choosing to open the first AI research facility in Africa there. CIPS Risk Index - The Chartered Institute of Procurement and Supply. How do the colours on the Country Heatmap correspond to the Country Reports? The colour coding relates to D&B country scores which are divided into seven bands ranging from DB1 (lowest risk) to DB7 (highest risk).
Each band is subdivided into quartiles (a-d) with an ‘a’ designation representing slightly less risk than a ‘b’ and so on. Only the DB7 score is not divided into quartiles. How the CIPS Risk Index works The CIPS Risk Index is composed of multiple unique assessments undertaken by D&B’s economics team of over 40 in-house economists, data analysts and contributors working in-field across the world. The Digital Economy and Society Index (DESI) The Automation Readiness Index. Lloyd's City Risk Index. The extraordinary effect of the few: Just 10 threats account for 91% of the Total GDP@Risk. Humans harm themselves: Nearly half of the Total GDP@Risk is linked to Manmade threats, including Market crash, Cyber attack, Power outage and Nuclear accident. Cities with high asset values are the most financially exposed in absolute terms: Taipei, Tokyo, Seoul, New York, Hong Kong, Shanghai and London, have significant levels of economic exposure to catastrophic events.
The true cost of globalisation: In an increasingly interconnected and technologically dependent world, four Emerging threats – Cyber attack, Human pandemic, Plant epidemic and Solar storm – account for more than one fifth of the Total GDP@Risk. Market crash puts the most GDP@Risk globally: It represents nearly a quarter of all cities’ potential losses. Emerging economies have the most to lose: Lloyd’s City Risk Index 2015-2025 shows that, collectively, 71.47% of the Total GDP@Risk is carried by cities in emerging economies.
Corruption Perception Index. Global Emotions Index - Gallup. The Good Country - Measures Contribution to Common Good of Humanity. European Innovation Scoreboard - Innovative Performance in European Countries. European innovation scoreboard 2019 The 2019 edition of the scoreboard highlights that the EU's innovation performance continues to improve. Compared to last year, innovation performance improved for 24 EU countries and the growth rate of lower-performing countries compared to higher-performing countries has accelerated. Since 2011, the EU's average innovation performance has increased by 8.8 percentage points. The EU’s performance has surpassed the United States for the first time and has a considerable lead over Brazil, India, Russia, and South Africa.
However, China is catching up at 3 times the EU's innovation performance growth rate and Canada, Australia, Japan, maintain a performance lead over the EU. Global Innovation Index. The Global Innovation Index (GII) 2019 ranks and breaks down the innovation performance of 129 countries and economies around the world. The GII 2019 special theme analyzes the medical innovation landscape of the next decade, looking at how technological and non-technological medical innovation will transform the delivery of healthcare worldwide. Download report. Global Food Security Index. 2020 Global Hunger Index Results - Global, Regional, and National Trends - Global Hunger Index (GHI) - peer-reviewed annual publication designed to comprehensively measure and track hunger at the global, regional, and country levels.
Box 1.1 The Global Hunger Index (GHI) is a tool for comprehensively measuring and tracking hunger at global, regional, and national levels. GHI scores are based on the values of four component indicators: undernourishment (share of the population with insufficient caloric intake), child wasting (share of children under age five who have low weight for their height, reflecting acute undernutrition), child stunting (share of children under age five who have low height for their age, reflecting chronic undernutrition), and child mortality (mortality rate of children under age five, partly reflecting the fatal mix of inadequate nutrition and unhealthy environments). Based on the values of the four indicators, the GHI determines hunger on a 100-point scale where 0 is the best possible score (no hunger) and 100 is the worst.
Each country’s GHI score is classified by severity, from low to extremely alarming. Child mortality in Africa South of the Sahara is exceptionally high. SDG Index - Country Performance - Sustainable Development Goals (SDGs) A. T. Kearney Global Services Location Index. Global Cities Index. But foreign direct investment is only a piece of the puzzle.
The Chinese government’s exceptionally restrictive Internet regulations primarily impact global players and have resulted in China developing its own tech industry with a home court advantage. As a result, the aforementioned Tencent, as well as e-commerce juggernaut Alibaba and search engine Baidu, have been able to flourish. Additionally, the country has bolstered its workforce with efforts aimed at educating its own citizens and attracting outside talent. Global Terrorism Index. Global Slavery Index. World Risk Index Report & Interactive Map. Risk levels are easily decoded using our simplified color indicator, with blue representing countries with lower overall risk and red representing countries with higher levels of overall risk. You can also hover over individual countries to see how they perform in 11 specific areas of risk.
You’ll notice that each country has also been assigned an overall risk percentage, which indicates that specific location’s susceptibility to risk in relation to every country in the world. Countries with low amounts of overall risk typically share common characteristics like sophisticated economies, strong institutions, quality supply chains, low prevalence of organized crime, commitment to property rights, and freedom from corruption. About Freedom on the Net.
FreePartly FreeNot Free. Benchmarking Public Procurement - World Bank Group. ICC OPEN MARKETS INDEX - ICC - International Chamber of Commerce. Index of Economic Freedom: Promoting Economic Opportunity and Prosperity by Country. Open Company Data Index. World Press Freedom Index. Digital globalization: The new era of global flows. Soaring flows of data and information now generate more economic value than the global goods trade. Conventional wisdom says that globalization has stalled. But although the global goods trade has flattened and cross-border capital flows have declined sharply since 2008, globalization is not heading into reverse. Rather, it is entering a new phase defined by soaring flows of data and information. Audio Remarkably, digital flows—which were practically nonexistent just 15 years ago—now exert a larger impact on GDP growth than the centuries-old trade in goods, according to a new McKinsey Global Institute (MGI) report, Digital globalization: The new era of global flows.
The world is more connected than ever, but the nature of its connections has changed in a fundamental way. Trade was once largely confined to advanced economies and their large multinational companies. Individuals are using global digital platforms to learn, find work, showcase their talent, and build personal networks. Export credits. Last Updated: 21 August 2014. Business Cycle Indicators.
Energy Trilemma Index. Renewable Energy Country Attractiveness Index. Human Development Index (HDI) Vision of Humanity. Verisk Maplecroft. The Atlas of Economic Complexity.