
Investing in Water for a Green Economy: Services, Infrastructure, Policies ... - Google Books Italia - Scheda Paese - De Agostini Geografia - DeA WING - società, economia, lavoro, religione, moneta, risorse, governo, geopolitica, industria, PIL, turismo, giustizia, confini, nazione, capitale, densità di popolazione, divisione amministrativa, stati Infrastrutture di trasporto Si sono molto sviluppate fino agli anni 1980-90, anche se in modo non omogeneo e squilibrato sul territorio nazionale. La scelta degli anni ’50 e ’60 di privilegiare la strada a scapito della ferrovia ha ancora oggi ripercussioni significative, a causa dell’ingente traffico veicolare di persone e merci su gomma, delle problematiche ambientali, di sicurezza e di manutenzione della rete stradale e autostradale. Mentre proseguono le inchieste giudiziarie in merito al tragico crollo del ponte Morandi a Genova del 14-VIII-2018, che ha causato la morte di 43 persone e gravi disagi alla logistica e alla mobilità dei cittadini a Genova e in tutta la Liguria, il 28-VI-2019 è stata eseguita la demolizione dei monconi dell’infrastruttura. Rimane aperto il dibattito politico circa l’eventuale revoca della concessione alla società Autostrade per l’Italia S.p.A., che aveva in carico la gestione del tratto dell’A10 colpito dal crollo. Rete viaria. Rete ferroviaria. Porti.
GDP Per Capita and Infant Mortality correlation The following chart plots Infant Mortality on the x-axis (number of infant deaths per 1000 live births) against the GDP per capita on the y-axis, for all countries shown in the previous table. Please take a look and see if you agree with my remarks. Each dot represents one country. For example, USA is shown at the very top because its coordinates are: on the y-axis $30,200 = GDP per capita, and on the x-axis 6.44 = Infant Mortality. I've put labels to the points (countries) that to me seem to be deviating most from the average. The red dot next to Libya is supposed to be the "world". What about the countries well-below the average line? One last remark. Back to the "main" world-data page
Carta geografica: aree climatiche d'Europa | Clima Valutazione attuale: Dettagli Categoria principale: Fisica Categoria: Clima Creato Mercoledì, 22 Maggio 2013 14:36 Ultima modifica il Lunedì, 22 Maggio 2017 08:44 Scritto da Giorgio Sonnante Visite: 36177 Tags: carta geografica | clima | Europa fisica L'Europa è caratterizzata, in generale, da 5 climi: subartico a Nord;alpino nelle aree montuose più elevate;atlantico lungo l'Oceano;mediterraneo lungo il mare omonimo;continentale nelle parti rimanenti. La suddivisione è molto generica, perché in realtà esistono diversi microclimi (in particolare, il clima continentale può essere di vari tipi, a seconda dei fattori del clima). Carta geografica dei climi europei Clicca per ingrandire Descrizione di ogni clima Se vuoi conoscere le caratteristiche di ognuno dei climi, consulta i seguenti articoli. descrivono le caratteristiche di ognuno dei climi contenuti in questa carta geograficacontengono un grafico di sintesi che facilita lo studio dei climirinviano a climogrammi di approfondimento
Income, inequality, and pollution: a reassessment of the environmental Kuznets Curve Abstract Improvements in some measures of air and water quality can accompany rising per capita income, as illustrated by the so-called environmental Kuznets curve. For pollution variables which show such a relationship, we hypothesize that a more equitable distribution of power contributes to these outcomes, by enhancing the influence on policy of those who bear the costs of pollution, relative to the influence of those who benefit from pollution-generating activities. Keywords Pollution; Inequality; Power distribution; Environmental Kuznets curve Copyright © 1998 Elsevier Science B.V.
Regno Unito - Scheda Paese - De Agostini Geografia - DeA WING - società, economia, lavoro, religione, moneta, risorse, governo, geopolitica, industria, PIL, turismo, giustizia, confini, nazione, capitale, densità di popolazione, divisione amministrativa, Settore secondarioRisorse minerarie. Il paese possiede una buona produzione di idrocarburi. Il petrolio viene estratto soprattutto dai giacimenti sulla piattaforma continentale del Mare del Nord (Claymore, Forties, Brent, Ninian, Piper, Fulmar); giacimenti minori sono quelli di terraferma di Egmanton e Bothamsell (Nottinghamshire), Plungar (Leicestershire), Gainsborough (Lincolnshire) e Kimmeridge (Dorset). Estesa è la rete di oleodotti: i principali tratti sono quelli tra Finnart e Grangemouth, tra Purbeck e Southampton, tra Cruden Bay e Grangemouth, tra Tranmere e Heysham. Per il trasporto dei prodotti dalle raffinerie alle zone di consumo sono in funzione gli oleodotti Stanlow-Manchester, Fawley-Severnside, Fawley-Londra, Walton on Thames-Londra. Altri oleodotti trasportano il greggio dai pozzi del Mare del Nord alle raffinerie della costa.
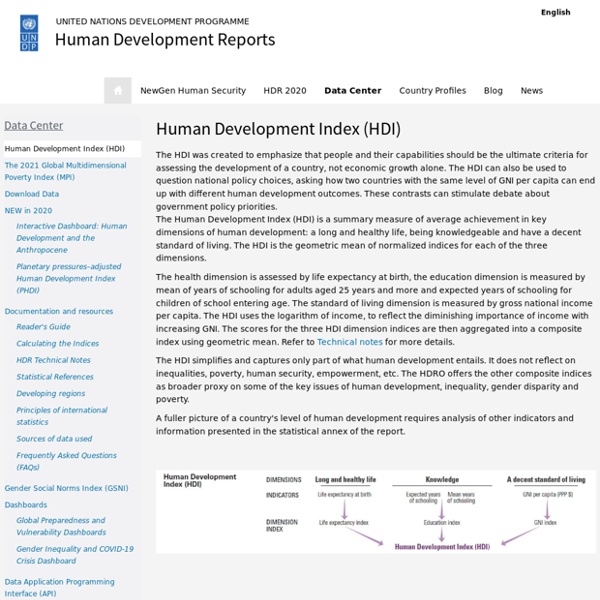
Human Development Index In the 2010 Human Development Report a further Inequality-adjusted Human Development Index (IHDI) was introduced. While the simple HDI remains useful, it stated that "the IHDI is the actual level of human development (accounting for inequality)" and "the HDI can be viewed as an index of "potential" human development (or the maximum IHDI that could be achieved if there were no inequality)".[3] World map by quartiles of Human Development Index in 2013. Origins Mahbub-ul-Haq Amartya Sen Dimensions and calculation New method (2010 Report onwards)[6] Published on 4 November 2010 (and updated on 10 June 2011), starting with the 2010 Human Development Report the HDI combines three dimensions: A long and healthy life: Life expectancy at birthEducation index: Mean years of schooling and Expected years of schoolingA decent standard of living: GNI per capita (PPP US$) In its 2010 Human Development Report, the UNDP began using a new method of calculating the HDI. 1. 2. 3. Old method (before 2010 Report) and
Raccolte cartografiche - Diacronie XIV-XX sec. » IEG-MAPS [DE]URL: Server per le carte storiche digitali: dodici raccolte di carte storiche, suddivise per periodo e area geografica, dal XIV al XX sec. XX Secolo » Historical Atlas of Twentieth Century [EN]URL: Una completa selezione di carte topografiche del 20°secolo. Europa: 1792 – XX sec. » European Maps – Europe 66 Introduction to Modern Europe [EN]URL: Carte storiche d’Europa, dal 1792 alla Guerra Fredda. Europa: VIII sec. a. » Historical Maps of Europa [EN]URL: Della Perry-Castañeda Library Map Collection, una vasta e completa raccolta on-line di mappe storiche di tutte le regioni europee. | The Perry-Castañeda Library map collection Carte tematiche XVIII – XIX sec. Portogallo: XIX sec. Portogallo: cartografia urbana Danimarca e area scandinava Nord America
Regression with Stata: Lesson 1 - Simple and Multiple Regression Regression with Stata Chapter 1 - Simple and Multiple Regression Chapter Outline 1.0 Introduction 1.1 A First Regression Analysis 1.2 Examining Data 1.3 Simple linear regression 1.4 Multiple regression 1.5 Transforming variables 1.6 Summary 1.7 Self assessment 1.8 For more information 1.0 Introduction This book is composed of four chapters covering a variety of topics about using Stata for regression. We should emphasize that this book is about "data analysis" and that it demonstrates how Stata can be used for regression analysis, as opposed to a book that covers the statistical basis of multiple regression. This first chapter will cover topics in simple and multiple regression, as well as the supporting tasks that are important in preparing to analyze your data, e.g., data checking, getting familiar with your data file, and examining the distribution of your variables. You can access this data file over the web from within Stata with the Stata use command as shown below. cd c:\regstata
L'economia della Serbia Il paese, non particolarmente ricco di risorse, visse un periodo di sviluppo tra gli anni Sessanta e Settanta del Novecento, grazie agli aiuti concessi dai paesi occidentali in riconoscimento della sua posizione autonoma dal blocco sovietico. L’economia del paese iniziò a segnare il passo alla fine degli anni Settanta, per aggravarsi nel decennio successivo – quando l’inflazione raggiunse picchi elevatissimi – e complicarsi ulteriormente negli anni Novanta, quando la Serbia fu coinvolta nella guerra civile e colpita dalle sanzioni imposte dalle Nazioni Unite in seguito al conflitto bosniaco; applicate a partire dal maggio del 1992, le sanzioni compresero il blocco totale del commercio estero, la chiusura dei collegamenti aerei, il ritiro delle rappresentanze diplomatiche, il blocco dei beni finanziari all’estero e l’esclusione del paese dagli scambi internazionali culturali e sportivi. Conseguenze della guerra per l'economia
Testing the assumptions of linear regression Quantitative models always rest on assumptions about the way the world works, and regression models are no exception. There are four principal assumptions which justify the use of linear regression models for purposes of prediction: (i) linearity of the relationship between dependent and independent variables (ii) independence of the errors (no serial correlation) (iii) homoscedasticity (constant variance) of the errors (a) versus time (b) versus the predictions (or versus any independent variable) (iv) normality of the error distribution. If any of these assumptions is violated (i.e., if there is nonlinearity, serial correlation, heteroscedasticity, and/or non-normality), then the forecasts, confidence intervals, and economic insights yielded by a regression model may be (at best) inefficient or (at worst) seriously biased or misleading. How to detect: The best test for residual autocorrelation is to look at an autocorrelation plot of the residuals.
A.M.A. - Associazione Marchigiana Astrofili: gli articoli di Pulsar Nel famosissimo romanzo di Jules Verne, Il Giro del Mondo in ottanta giorni, il protagonista Phileas Fogg, nel rientrare a Londra, avendo compiuto il giro della Terra viaggiando verso Est, credeva di aver perduto la scommessa, avendo impiegato, secondo i suoi calcoli, un giorno in più. Si accorse però, con sua somma meraviglia, che i giorni impiegati erano gli ottanta preventivati. Come si spiega scientificamente la differenza di un giorno tra il conteggio tenuto diligentemente da Fogg e la data trovata a Londra? (Luca Sassaroli) Approfittiamo della domanda posta dal gentile lettore per ricordare che quest'anno ricorre il centenario della morte di Jules Verne (1828-1905). Ma veniamo alla questione delle ventiquattro ore che si perdono o si guadagnano nel fare il giro della Terra verso Est o verso Ovest. La spiegazione è contenuta già in queste parole e venne fornita da Pietro Martire d'Anghiera.