
Atlas of the Human Planet: Free GIS Data and Tools - GIS Lounge. The Atlas of the Human Planet 2020 is the most recent global atlas that provides geoinformation for research, policy, and action that can be used to document the presence of humanity on Earth.
This forms a key effort of the Global Human Settlement Layer (GHSL) that has updated the earlier Atlas of the Human Planet, such as the one from 2019. Downloading Geospatial Data from the Atlas of the Human Planet Data and tools can be downloaded from the GHSL and Atlas. The intent is to provide data for disaster risk reduction and crisis management related to environmental problems, urbanization, and aid in the effort for sustainable development. Members of the Group of Earth Observation (GEO) Human Planet Initiative, including the European Commission (EC), various international organisations such as the Organisation for Economic Cooperation and Development (OECD), the World Bank, private sector, and academic institutions have contributed data used for the initiative. References Related. Youtube. A Roundup of Geospatial Podcasts - GIS Lounge. Every few months it seems like a new GIS or geospatial podcast is being launched.
Here’s a roundup of what’s available. Africa GeoConvoAfrica GeoConvo is a podcast about geospatial innovations and people doing great things with geospatial technology in Africa. Visit: Africa GeoConvo Cageyjames & GeoBabblerWith the tagline, “Two old guys talk about new spatial technology”, this monthly podcast is hosted by two geospatial industry veterans: James Fee and Bill Dollins. Google Environmental Insights Explorer - Make Informed Decisions. <h1>Environmental Insights Explorer</h1><p>Impact begins with insights.

Explore data to make informed decisions and inspire action. </p><p> Explore estimated carbon emissions from transportation and buildings, rooftop solar energy potential, and NASA climate forecasts, derived from Google’s proprietary data and leading data sources. OpenStreetMap is Having a Moment. The Billion Dollar Dataset Next Door. Special thanks to Jennings Anderson who looked over an early draft of this post and helped me refine it.
Also, as usual, the views expressed herein do not represent those of my parents, my wife, my dentist, or my employer. The first time I spoke with Jennings Anderson, I couldn’t believe what he was telling me. Youtube. ArthurRuf/3dcitybuilder: Generate 3D Models of Urban Areas. QGIS Style Sharing Repository - GIS Lounge. A new tool has been deployed that lets QGIS users share style files.
Style files are used in QGIS to set cartographic visualizations for individual layers. Features such as symbology, fonts, a color ramps can be set via a style file. Users can access the various styles they have in their instance of QGIS by selecting Setting –> Style Manager from the top menu options. Earth Engine Data Catalog Earth Engine's public data catalog includes a variety of standard Earth science raster datasets.
You can import these datasets into your script environment with a single click. You can also upload your own raster data or vector data for private use or sharing in your scripts. Looking for another dataset not in Earth Engine yet? Google Earth Engine User Summit 2018 Presentations - GIS Lounge. Google Earth Engine. Google Earth Engine Applications.
Atlas Histórico Mundial y Cronologías. CURSO BÁSICO DE QGIS 2020. Clase N° 4. Simbología y Etiquetado. Self-Guided QGIS Courses - GIS Lounge. GIS User Conference, Seminar & Event Videos. Tutorial: Introduction to Geospatial Analysis in R - GIS Lounge. If you missed the recently webinar entitled “Introduction to Geospatial Analysis in R” hosted by NASA and the Oak Ridge National Laboratory (ORNL) , you can catch the video and access the associated documents.
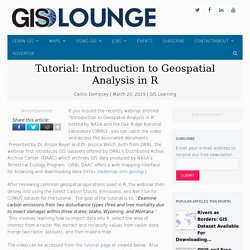
Presented by Dr. Alison Boyer and Dr. Jessica Welch, both from ORNL, the webinar first introduces GIS datasets offered by ORNL’s Distributed Active Archive Center (DAAC) which archives GIS data produced by NASA’s Terrestrial Ecology Program. Rivers as Borders: GIS Dataset Available For Downloading - GIS Lounge. Earlier this spring, Laurence Smith, professor of Earth, Environmental and Planetary Sciences at Brown University, released his latest work, “Rivers of Power: How a Natural Force Raised Kingdoms, Destroyed Civilizations, and Shapes Our World.”
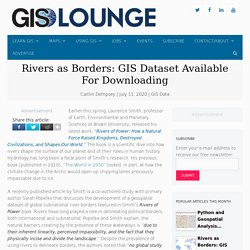
The book is a scientific dive into how rivers shape the surface of our planet and of their roles in human history. Hydrology has long been a focal point of Smith’s research. His previous book (published in 2010), “The World in 2050” looked, in part, at how the climate change in the Arctic would open up shipping lanes previously impassable due to ice. Los logros e hitos más notables del sector geoespacial en los últimos 20 años. Entrada actualizada el 18 de junio de 2020 con hitos desde 1982 hasta el año 2020 El lanzamiento de la edición 72 de la revista MundoGEO (edición especial de cumpleaños) nos trae, entre otras cuestiones, una línea de tiempo con los logros más notables del sector geoespacial en el período 1998-2013.
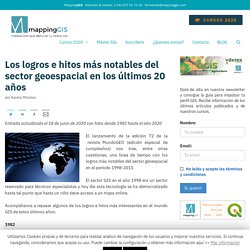
El sector GIS en el año 1998 era un sector reservado para técnicos especialistas y hoy día esta tecnología se ha democratizado hasta tal punto que hasta un niño tiene acceso a un mapa online. Breaking Down Geocoding in R: A Complete Guide.
Humanistic GIS Laboratory – Leverage GIS with Humanism. Global Refugee Atlas. The Global Refugee Atlas visualizes and narrates core experiences of the millions of refugees under the United Nations High Commissioner for Refugees (UNHCR) mandate using remote sensing data, crowdsourced social media data as well as a host of datasets from UNHCR and other international humanitarian agencies.
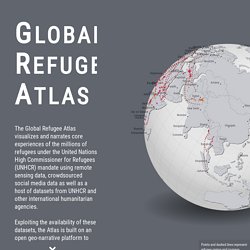
Exploiting the availability of these datasets, the Atlas is built on an open geo-narrative platform to illuminate the contexts and conditions underlying refugee journeys and camps. About The Atlas is divided in five chapters that explore different aspects of the refugee experience, from the causes that generate international crises to the perception of social media users throghout the world. Refugee experiences are highlighted through the use of geo-narratives using as case studies two stories: refugees escaping the brutality of the Burundian civil war and Somali refugees trying to reach the Mediterranean shores (Journeys section). EpiRisk. Loading... Welcome to EpiRisk EpiRisk is a computational platform designed to allow a quick estimate of the probability of exporting infected individuals from sites affected by a disease outbreak to other areas in the world through the airline transportation network and the daily commuting patters.
It also lets the user to explore the effects of potential restrictions applied to airline traffic and commuting flows. Based on the number of infected individuals detected in one or more areas of the world, the platforms estimates two main quantities. · Exported cases: the tool computes the probability P(n) of exporting a given number of cases n from the origin of the disease outbreak.
. · Relative importation risk: for each location Y the platform evaluates the probability P(Y) that a single infected individual is traveling from the index areas to that specific destination Y. International-Domestic spreading of 2019-nCoV-V4. Novel Coronavirus Infection Map. This online interactive map enables users to track both the global and local trends of Novel Coronavirus infection since Jan 21st, 2020.
The supporting dataset is timely collected from multiple official sources and then plotted onto this map. Data Sources The data are mainly collected from 1. National Health Commission (NHC) of the People’s Republic of China 2. China’s Provincial & Municipal Health Commission, China’s Provincial & Municipal government database 3. In the data table, each entry indicates the infection status in the format of "#-#-#-#" -- a 4-sequel entry divided by dashes. Update Procedure. Diferencias entre técnico GIS, analista GIS y consultor GIS.
Si para un profesional que trabaja con SIG en ocasiones es difícil explicar a un profano a qué nos dedicamos, quizá más complicado es establecer una categoría a nuestros conocimientos. Las habilidades que deberían tener un técnico GIS, un analista GIS o un consultor en Sistemas de Información Geográfica son diferentes. Vamos a intentar esclarecer qué habilidades debería tener cada uno, empezando de menos a más. New Course: QField Quickstart - Geospatial Brainstorming. QField is an open-source Android based mobile data collection and/or viewing application that is tightly integrated with QGIS. QGIS is used to set up the project using standard QGIS tools. If the layers in your project are stored in a PostGIS database and a mobile data connection is available then changes made in QField are made directly to your database and visible in real-time to anyone that has a client to your database. This, in my view, is the mobile data collection killer app. QGIS symbology is recreated in QField.
QGIS edit widgets are used to create data entry forms in QField. If a relate is set up in the QGIS project then the same relates are used in QField to create child records, such as plant composition associated with a point. If print layouts are created in the QGIS project then those print layouts can be used to generate PDF documents on the device and emailed to project managers or clients.
EarthPy: Python Package for Plotting and Working with Spatial Data. A Python language spatial package, called EarthPy, has been released for free download for spatial analysts and scientists interested in conducting various forms of analyses without necessarily having a lot of background knowledge on Python or spatial analysis. EarthPy was initially created by and for Earth system science with a heavy emphasis on raster data.
However, the tool has now also incorporated vector-based and spatial methods that allow it to be extended into other application areas. Free Online Geocoder. Developed by LocalFocus, this online geocoder will generate lat/long coordinates for a list of addresses for free. Listed as a “Batch geocoder for journalists” this online geocoder can be used by anyone needing to convert a list of locations to latitude and longitude coordinates. The online geocoder is built using open GIS data from OpenStreetMap, OpenAdressess, and Who’s on first. Pelias, an open-source geocoder, is used to generate the lat/long coordinates from addresses.
GISCI > Home. GIS&T Body of Knowledge. Food and Agriculture Organization of the United Nations. Agriculture, globally provides direct livelihoods for 2.5 billion people and feeds the entire planet. It must, by 2050, produce 49 percent more food than in 2012 as populations grow and diets change. Yet climate change, biodiversity loss, land degradation, water scarcity, pollution and many other challenges are hampering these efforts to feed the planet. The undertaking under the 2030 Sustainable Development Agenda is for everyone to address these issues; it is clear however that no meaningful and effective action can be taken without sound and timely data to inform and guide decision makers. Tutorial Quantum GIS. World Bank and Geospatial Data. UNSD — UN-GGIM. John Snow's data journalism: the cholera map that changed the world. Updated Snow GIS data « Robin's Blog. Free GIS Datasets - Categorised List.
PredictionX: John Snow and the Cholera Epidemic of 1854. How to Change the Projection of a Shapefile Using QGIS. Geospatial Revolution Project Explored. FOSS4G Academy Curriculum. Learn GIS for Free. How Redlining Communities Affects Health - GeoLounge: All Things Geography. Case Study: How Brindisi, Italy is Using GIS to Help Preserve its Ancient Architecture. R Packages for Spatial Analysis. A Case Study on Converting a Geodatabase From ArcGIS for Use in QGIS. Mapping Migration Based on Search Data. Spatial Data Science with R — R Spatial. Descarga gratis más de 90,000 increíbles mapas históricos. R Packages for Spatial Analysis. Free Ways to Learn QGIS. Geographic Information Systems Technician. Uclaextension. Qgis shapefile edition. Missed the Latest QGIS User Conference? Access the Videos Online. PyQGIS 101: Hello world! Free ePDF: Mapping Society: The Spatial Dimensions of Social Cartography - GeoLounge: All Things Geography.
World-Historical Gazetteer – A project of the World History Center at the University of Pittsburgh. Geographically weighted regression. FAO Uses GIS to Protect Agricultural Economy of Vulnerable Countries. QGIS Academy. Public participatory historical GIS: Historical Methods: A Journal of Quantitative and Interdisciplinary History: Vol 0, No 0. Online Course - Introduction to GIS in R. Regression Analysis for Spatial Data (Boulder, CO) An Introduction to Spatial Econometrics in R. An Introduction to Spatial Econometrics. Sbook. Spatial Econometrics.
Free Urban Planning GIS Exercises – GIS Lounge. PyQGIS 101: Introduction to QGIS Python programming for non-programmers. Creating Dynamic Maps in QGIS Using Python: QGIS Python Programming CookBook. GIS and Digital Humanities. Inicio. Program - New Maps Plus. Geographic Information Systems certificate.
GIS and Geospatial Technology. TNM Download. TopoView. Historical Maps at Your Fingertips. Geography of Suicide: A Look at the CDC's Recent Report - GeoLounge: All Things Geography. Introduction to QGIS Python Programming. Creating Dynamic Maps in QGIS Using Python: QGIS Python Programming CookBook. FOSS4G Academy Curriculum. The National Map: Historical Topographic Map Collection.
Overview - Maps. Google Earth Engine. Geography and GeoInformation Science – Graduate Certificate in Geospatial Intelligence. Collegiate Accreditation - USGIF. La importancia de usar R en GIS. Two Centuries of US Immigration Visualized. Bill's quick guide to maps and GIS data online. After the Map. Regression analysis of spatial data - Beale - 2010 - Ecology Letters.
EarthTime. CGA Web Maps. DARMC 1.3.1. HDV - Historical Data Visualization. Harvard CGA.