
Change Detection Analysis (Using ENVI) Change Detection Analysis encompasses a broad range of methods used to identify, describe, and quantify differences between images of the same scene at different times or under different conditions.
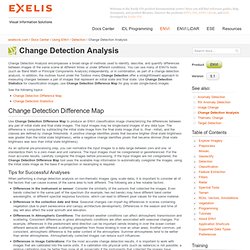
You can use many of ENVI's tools (such as Band Math or Principal Components Analysis) independently, or in combination, as part of a change detection analysis. DEM to Contours using QuantumGIS. For those who don’t want to spend bucks for ESRI’s Spatial Analyst extension there is an absolutely free (and open source) solution to export contour lines from a Digital Elevation Model (DEM).
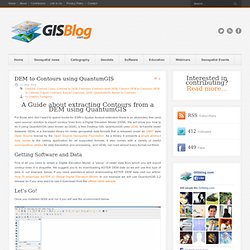
We will show you how to do it using QuantumGIS (also known as QGIS), a free Desktop GIS. QuantumGIS uses GDAL to handle raster datasets. GDAL is a translator library for raster geospatial data formats that is released under an X/MIT style Open Source license by the Open Source Geospatial Foundation. As a library, it presents a single abstract data model to the calling application for all supported formats.
Features. We developed Natural Earth as a convenient resource for making custom maps.
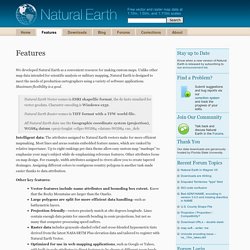
Unlike other map data intended for scientific analysis or military mapping, Natural Earth is designed to meet the needs of production cartographers using a variety of software applications. Maximum flexibility is a goal. Natural Earth Vector comes in ESRI shapefile format, the de facto standard for vector geodata. Character encoding is Windows-1252. Download free shapefile maps. Thousands of shapefile maps can be downloaded for free from the following websites, including country shapefiles, shapefiles at province or state level, and other administrative boundaries maps.
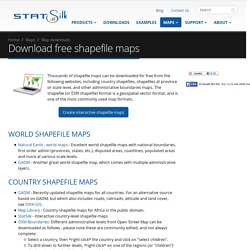
The shapefile (or ESRI shapefile) format is a geospatial vector format, and is one of the most commonly used map formats. Create interactive shapefile maps WORLD shapefile maps Natural Earth - world maps - Excellent world shapefile maps with national boundaries, first order admin (provinces, states, etc.), disputed areas, coastlines, populated areas and more at various scale levels.
GADM - Another great world shapefile map, which comes with multiple administrative layers. COUNTRY shapefile maps GADM - Recently updated shapefile maps for all countries. Download free ArcGIS GIS shapefile maps Geospatial Data for Digital Cartography. Sponsors Page 1 of 4, Go To Next Page Doing GIS doesn't have to be expensive or complicated.
If you are new to GIS, check out our free GIS tutorial and atlas. Then download free GIS software and free ArcGIS shapefiles here on these pages. Free World Shapefiles by Country. Ebola Outbreak Maps & Shapefiles IPCC Climate Change Scenario Shapefiles for Precipitation and Temperature, 2000 through 2099. U.S. Geological Survey Open-File Report 2007-1186. The U.S.
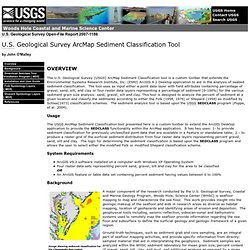
Geological Survey (USGS) ArcMap Sediment Classification tool is a custom toolbar that extends the Environmental Systems Research Institute, Inc. (ESRI) ArcGIS 9.2 Desktop application to aid in the analysis of seabed sediment classification. Elevation Contours - 10 metre interval - by Local Government Area - digital data for download (Department of Environment and Resource Management) Short, Self Contained, Correct Example. Extract csv file specific columns to list in Python. Flow Map Layout. Flow Mapping with Graph Partitioning and Regionalization. Flow Mapping with Graph Partitioning and Regionalization is an integrated software tool to explore flow patterns in large spatial interaction data.
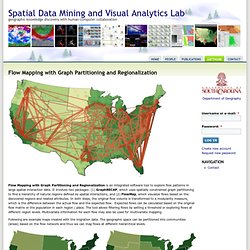
It involves two packages: (1) GraphRECAP, which uses spatially constrained graph partitioning to find a hierarchy of natural regions defined by spatial interactions; and (2) FlowMap, which visualize flows based on the discovered regions and related attributes. In both steps, the original flow volume is transformed to a modularity measure, which is the difference between the actual flow and the expected flow. Expected flows can be calculated based on the original flow matrix or the population in each region / place. The tool allows filtering flows by setting a threshold or exploring flows at different region levels. Earth Outreach. With Google Maps Engine, you can upload geographic data in many different file formats.
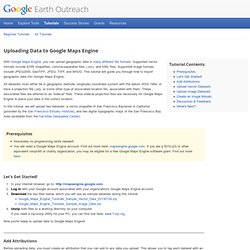
Supported vector formats include ESRI shapefiles, comma-separated files (.csv), and KML files. Supported image formats include JPEG2000, GeoTIFF, JPEG, TIFF, and MrSID. This tutorial will guide you through how to import geographic data into Google Maps Engine. All datasets must either be in geographic (latitude, longitude) coordinate system with the datum WGS 1984, or have a projection file (.prj), or some other type of associated location file, associated with them. District-wise monthly rainfall data (2004-2010) & list of raingauge stations, India Meteorological Department (IMD)
Monthly rainfall data from 2004-2010 and raingauge stations list for the complete country, in the form of a spreadsheet that can be downloaded.
The India Meteorological Department Rainfall data In response to an RTI petition filed by the South Asia Network on Dams, Rivers and People, the Indian Meteorological Department (IMD) has made rainfall data for the past few years available at a monthly level, for each district of the country on their website. India Water Portal has imported all the data from 2004-2010 into a spreadsheet that you can download and save for future use. Met Data. From spatial interaction data to spatial interaction information? Geovisualisation and spatial structures of migration from the 2001 UK census. Abstract In modern GIS applications, flow mapping and geodynamics are not particularly well represented.
This is somewhat surprising given the potential of such approaches to shed light on the spatial characteristics associated with the movement of people and goods. Despite the attention of a select number of researchers whose contributions have been significant, however, the subject matter remains underdeveloped and the full potential of spatial interaction data remains largely unrealised. Therefore, this paper represents an attempt to popularise the use of flow mapping within a contemporary GIS, with a view to aiding and enhancing decision support at a range of different spatial scales.
It discusses advances in flow mapping, proposes an approach to mapping a large migration matrix from the United Kingdom’s 2001 census, and considers the ways in which this can add value to the understanding of geographical patterns of residential mobility. Keywords 1. Maps and the Geospatial Revolution. About the Course The past decade has seen an explosion of new mechanisms for understanding and using location information in widely-accessible technologies. This Geospatial Revolution has resulted in the development of consumer GPS tools, interactive web maps, and location-aware mobile devices.
These radical advances are making it possible for people from all walks of life to use, collect, and understand spatial information like never before. This course brings together core concepts in cartography, geographic information systems, and spatial thinking with real-world examples to provide the fundamentals necessary to engage with Geography beyond the surface-level. MESH Atlantic webGIS. Untitled. Biology & control of vector-borne infections in Europe. EDENext, Biology and control of vector-borne infections in Europe, is a research project bringing together 46 international teams dedicated to investigating the biological, ecological and epidemiological components of vector-borne disease introduction, emergence and spread, and the creation of new tools to control them.
For more details on the EDENext project itself visit the project website www.edenext.eu. How to convert degrees/minutes/seconds angles to or from decimal angles in Excel 2000. Angular measurements are commonly expressed in units of degrees, minutes, and seconds (DMS). One degree equals 60 minutes, and one minute equals 60 seconds. To simplify some mathematical calculations you may want to express angular measurements in degrees and decimal fractions of degrees. This article contains a sample custom function you can use to convert a degree value stored in decimal format, to DMS stored in text format, and a sample function that converts DMS to a degree value stored in decimal format.
Microsoft provides programming examples for illustration only, without warranty either expressed or implied, including, but not limited to, the implied warranties of merchantability and/or fitness for a particular purpose. Terminology and Basic Questions About GIS. How to fill the gap in Landsat 7 ETM+? For this time we will employ ENVI (commercial software) using mosaicking module to fill the gap of Landsat 7 ETM+ Noted: Multiple SLC-off images with the same season and year are required to utilize this method. Individual bands of each image need to be gap-filled before creating a RGB image.
For instance, in order to gap-fill Image A with Image B, a mosaic will need to be made of Band1 from Image A and Image B together. The bands can then be stacked to create the RGB image. NTT DATA and RESTEC launch the World’s Most Precise Digital 3D Map of the Entire World. “3D maps that you look at” change to “3D maps that you can use” with the world’s first Digital Elevation Model with 5-meter resolution. 3D map subjected to color processing (Everest)Image Courtesy: NTT DATA NTT DATA Corporation and the Remote Sensing Technology Center of Japan (RESTEC) have jointly begun a “Distribution Service for a Digital 3D Map of the Entire World” that utilizes satellite images.
This service uses approximately 3 million satellite images captured by the Advanced Land Observing Satellite “DAICHI” (ALOS)*1 of the Japan Aerospace Exploration Agency (JAXA) and distributes the world’s most precise digital 3D map*2, covering the land of the entire world. Starting in March of 2014, this will be distributed sequentially starting in areas that have been developed, and by March of 2016, the map of the entire world is scheduled to be completed. Arcgis 10.0 - How to calculate for every basin/sub-basin, drainage area at every elevation contour along stream.
These are actually multiple questions, and should maybe be split up, but here is a partial answer regarding the calculation of the percentage of the watershed upstream for each pixel along the flowpath: Digimap Ltd, Guernsey. Java Image Processing Cookbook. A Brief Tutorial on Supervised Image Classification Introduction This tutorial presents basic concepts on image classification. Chapter_18_Classification of a Landsat Image (Unsupervised).pdf.
Converting Decimal Degrees to. CerraWhispers_revised.pdf. GIS in the Hindu Kush-Himalayan Mountains. The sustainable management and development of natural resources in the Hindu Kush-Himalayan region is a complex task. Relevant and precise information is essential for appropriate planning at all levels of the decision making chain. Natural Earth. Data integration using knowledge driven GIS. Methodology_drainage extarction. Tracing Landsat 8 for OpenStreetMap. Want to help update OpenStreetMap with fresh, free Landsat 8 imagery? Here’s how to get started tracing whatever interests you, even if you’ve never edited OpenStreetMap before. Start by finding a place where OSM needs attention to relatively large features – Landsat imagery’s strength is on things like highways, coastlines, and rivers.
6 Phd Positions (Promovendi) in the Field Of Geo-Information, Remote Sensing and GIS at ITC Netherlands. The faculty ITC provides international postgraduate education, research and project services in the field of geo-information science and earth observation using remote sensing and GIS. The aim of ITC’s activities is the international exchange of knowledge, focusing on capacity building and institutional development in developing countries and emerging economies Job specification.
Working at the University of Twente. Arcgis 10.0 - script to create points in interval 0.125 decimal degree. You already have your answer; you have your start X/Y and finish X/Y, so you have a range and the distance between the points Calculate the amount of points you will create per axis. Arcgis 10.0 - How to calculate XY coordinates in Decimal Degrees from projected dataset in model or script? Meteorological datasets: Download entire datasets for various meteorological indicators from 1901 to 2002.
Working with Cartographic Representations. Introduction to Cartographic Representations in ArcGIS 9 2. WellTracking - Overview. TRMM. WellTracking - business without risk new. Cartography Lessons- Symbology to Representations and using the Marker Editor. Aspect-slope map. What's new for VBA developers with ArcGIS 10 (ArcObjects VBA 10 SDK)