
Multispectral Analysis of Satellite Imagery with... - Hatari Water. Making a Map. [ Download PDF A4 Letter ] Often one needs to create a map that can be printed or published.
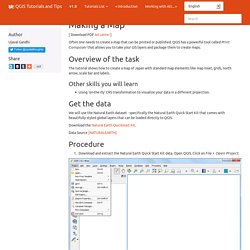
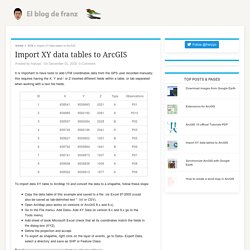
QGIS has a powerful tool called Print Composer that allows you to take your GIS layers and package them to create maps. Overview of the task The tutorial shows how to create a map of Japan with standard map elements like map inset, grids, north arrow, scale bar and labels. Import XY data tables to ArcGIS. It is important to have tools to add UTM coordinates data from the GPS user recorded manually; this requires having the X, Y and / or Z inserted different fields within a table, or tab separated when working with a text file fields.
SpatialHydrology.com - Tutorials. UAV Remote Sensing for Urban Vegetation Mapping - GIS Resources. Vegetation plays an important role in urban environments from many prospects, i.e., alleviating urban heat island effect, maintaining ecological balance, protecting biodiversity and promoting quality of life.
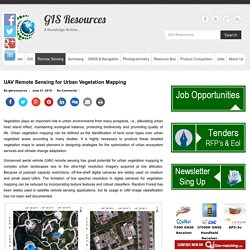
Urban vegetation mapping can be defined as the identification of land cover types over urban vegetated areas according to many studies. It is highly necessary to produce these detailed vegetation maps to assist planners in designing strategies for the optimization of urban ecosystem services and climate change adaptation. The Advantages of a UAV - LiDAR News. Mobile laser scanning and airborne laser scanning point clouds come with their unique advantages and disadvantages.

Mobile laser scanners cannot acquire data from building rooftops and the airborne laser scanners cannot acquire data from building facades because of their view angles. Therefore the point cloud measurements from any of these two scanners have areas which do not have enough points to represent the 3D structures properly. One solution to increase the density of point clouds is to use UAV cameras.
Tony Nedkov has used a UAV camera in order to generate point cloud of a specific building. To do so, Tony has applied Structure from Motion (SfM) techniques to the acquired video. Primary steps of his work can be seen in the following images and in the video provided with the link below. Thanks to Beril Sirmacek for this post.
Post classification in ENVI. Mapping Scientific Excellence. Incorporating Spatial Perspectives. Download Free RADARSAT Data of Canada - GIS Resources. Canada’s RADARSAT-1 is a radar satellite and was launched in November 1995.
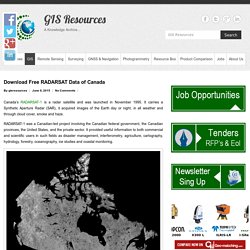
It carries a Synthetic Aperture Radar (SAR), it acquired images of the Earth day or night, in all weather and through cloud cover, smoke and haze. RADARSAT-1 was a Canadian-led project involving the Canadian federal government, the Canadian provinces, the United States, and the private sector. It provided useful information to both commercial and scientific users in such fields as disaster management, interferometry, agriculture, cartography, hydrology, forestry, oceanography, ice studies and coastal monitoring. RADARSAT orthorectified mosaic image of Canada The Government of Canada provides free access to RADARSAT through the website “Natural Resources Canada”.
Cracked softwares. Good Webpages/Blogs/resources. Datasets. From Sathis. Tutorials. Digital Earth. How to convert Landsat DNs to Brightness Temperature using ENVI Standard. The Landsat Thematic Mapper (TM) and Enhanced Thematic Mapper Plus (ETM+) sensors acquire Thermal InfraRed (TIR) data and store this information as a digital number (DN) with a range between 0 and 255.
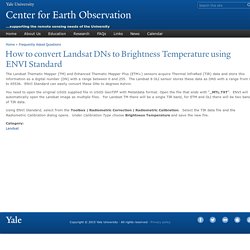
The Landsat 8 OLI sensor stores these data as DNS with a range from 0 to 65536. ENVI Standard can easily convert these DNs to degrees Kelvin. You need to open the original USGS supplied file in USGS GeoTIFF with Metatdata format. Open the file that ends with “_MTL.TXT”. ENVI will automatically open the Landsat image as multiple files.
Using ENVI Standard, select from the Toolbox | Radiometric Correction | Radiometric Calibration. Land Surface Properties, Regional Climate Feedbacks and Urban Adaptations. Home > Landsat 8 Understanding Landsat 8 In order to better understand and analyze the new Landsat 8 satellite images for environmental monitoring, the Yale Center for Earth Observation is conducting an in-depth analysis into various highlights and shortcomings one should be aware of when handling these satellite images.
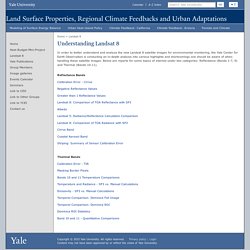
Below are reports for some topics of interest under two categories: Reflectance (Bands 1-7, 9) and Thermal (Bands 10-11). Reflectance Bands. Image - Free radar (SAR) satellite data. Definitions for land cover categories. SMAP: Data Products. The SMAP baseline science data products are shown in the table below.
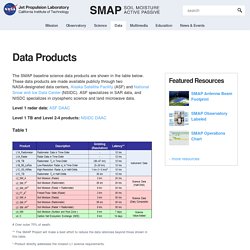
These data products are made available publicly through two NASA-designated data centers, Alaska Satellite Facility (ASF) and National Snow and Ice Data Center (NSIDC). ASF specializes in SAR data, and NISDC specializes in cryospheric science and land microwave data. Level 1 radar data: ASF DAAC. Using 3D profiler in spatial analyst. Landsat 8: Estimating Land Surface Temperature Using ArcGIS. Multicriteria analysis to study erosion risk using ArcGIS. Today we are going to study the erosion risk of a terrain.
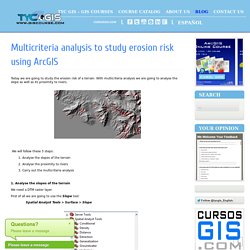
With multicriteria analysis we are going to analyse the slope as well as its proximity to rivers. We will follow these 3 steps: 1. Analyse the slopes of the terrain 2. 3. 1. We need a DTM raster layer. First of all we are going to use the Slope tool: LiDAR_Full_Notes.pdf. Airborne Altimetric LiDAR: Tutorial. Geographic information systems in fisheries management and planning. Technical manual.
Raster data is a method for storage, processing, and display of spatial data.
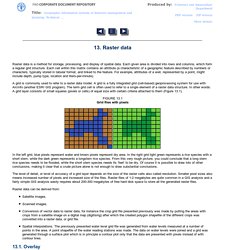
Each given area is divided into rows and columns, which form a regular grid structure. Each cell within this matrix contains an attribute (a characteristic of a geographic feature described by numbers or characters, typically stored in tabular format, and linked to the feature. For example, attributes of a well, represented by a point, might include depth, pump type, location and liters-per-minute). H-SAF Official Web Site. Profile Index in the roots region by scatterometer data assimilation SM-DAS-2 is the H-SAF root zone soil moisture index product, retrieved by scatterometer assimilation in a the ECMWF Land Data Assimilation System. SM-DAS-2 production chain based on ASCAT surface soil moisture data assimilation in the ECMWF Land Data Assimilation System: Product description In the soil moisture assimilation system, the surface observation from ASCAT is propagated towards the roots region down to 2.89 m below surface, providing estimates for 4 layers (thicknesses 0.07, 0.21, 0.72 and 1.89 m).
DEM Data Sources Table. What are Geodetic Datums? Automated Image Segmentation – SARBayes. How to turn a USGS map or satellite photos into vector data? A couple of links, and some questions. Back when Adam Golding and I prototyped Probability Mapper we already had an algorithm that could give the probability based on distance, terrain, vegetation, and other factors. But we were working with raster images, so we only had distance. If you had vector layers for terrain & vegetation, you'd be set. ~Originally 9 June 2008. Image classification with Python – Remote Sensing News. Geospatial Analysis - spatial and GIS analysis techniques and GIS software. OpenLISEM – a spatial model for runoff, floods and erosion. Rainfall data The file containing the rainfall data is in ASCII-format and can have any name. The rainfall file should have the following structure (the second column is for explanation only and should beignored in the real file). If two or more raingauges are used, e.g. 3, the file should have the following structure: