
10 Free GIS Data Sources: Best Global Raster and Vector Datasets - GIS Geography. In a perfect world, you’d be able to find all the free GIS data you need in a single website. Of course, it would have to be free, downloadable from an authoritative source. …But well, you know the drill. The world’s not perfect, life’s not fair. So that’s why we’ve put together this list to turbo-charge your search for free GIS data. We provide a list of 10 free, downloadable global GIS datasets from highly reputable sources.
You might be interested in these useful resources for GIS data: 1 Natural Earth Data Natural Earth Data is first on the list because it does an amazing job to suit the needs of cartographers. Modèles numériques de prévision météo. Information : la carte que vous consultez actuellement n'est pas issue du dernier run disponible.
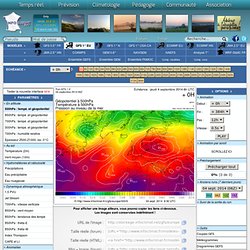
Cliquez ici pour revenir au dernier run. Information : le run que vous consultez est actuellement encore en cours de génération. Cette image est donc issue du run précédent. Raccourcis clavier : ←→↖↙DFESPACE + roulette de la souris sur la zone de scroll Quel type de coupe souhaitez-vous effectuer ? Quel type de données souhaitez-vous obtenir ? DataShine: 2011 OAC. The 2011 Area Classification for Output Areas, or 2011 OAC, is a geodemographic classification that was developed by Dr Chris Gale during his Ph.D at UCL Geography over the last few years, in close conjunction with the Office for National Statistics, who have endorsed it and adopted it as their official classification and who collected and provided the data behind the classification – namely the 2011 Census.
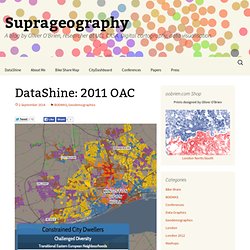
A geodemographic classification such as this takes the datasets and looks for clusters, where particular places have similar characteristics across many of the variables. It does this on a non-geographic basis, but spatial autocorrelation means that geographic groupings do typically appear – e.g. a particular part of an inner city will typically have more in common with another part of the inner city, than of the suburbs. However, these areas will often also share much in common with other “inner city” parts of cities elsewhere.
Direct link to the map.See also the DataShine blog. GEODATA. ICT and Geography. Introducing Smart Mapping. We want to introduce you to Smart Mapping, an exciting new capability built into the March 2015 update to ArcGIS Online.
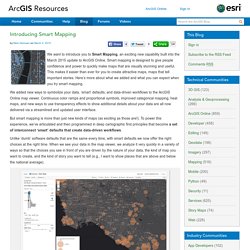
Smart mapping is designed to give people confidence and power to quickly make maps that are visually stunning and useful. This makes it easier than ever for you to create attractive maps, maps that tell important stories. Here’s more about what we added and what you can expect when you try smart mapping. We added new ways to symbolize your data, ‘smart’ defaults, and data-driven workflows to the ArcGIS Online map viewer.
Continuous color ramps and proportional symbols, improved categorical mapping, heat maps, and new ways to use transparency effects to show additional details about your data are all now delivered via a streamlined and updated user interface. But smart mapping is more than just new kinds of maps (as exciting as those are!). Given the nature of my data, what are the appropriate ways I can map this? Mapping the Local Geographies of Digital Inequality in Britain. 27 June 2014 The Internet has fundamentally reorganised economic, social and political actions and relationships around the world, and yet we know surprisingly little about the geography of Internet use and participation at sub-national scales.
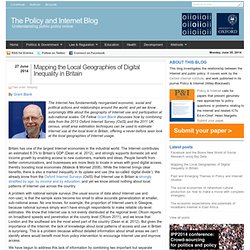
OII Fellow Grant Blank discusses how by combining data from the 2013 Oxford Internet Survey (OxIS) and the 2011 UK census, small area estimation techniques can be used to estimate Internet use at the local level in Britain, offering a never-before seen look at the local geographies of Internet usage. Britain has one of the largest Internet economies in the industrial world. The Internet contributes an estimated 8.3% to Britain’s GDP (Dean et al. 2012), and strongly supports domestic job and income growth by enabling access to new customers, markets and ideas.
People benefit from better communications, and businesses are more likely to locate in areas with good digital access, thereby boosting local economies (Malecki & Moriset 2008). References. Joseph Kerski, Ph.D. - GeographerJoseph Kerski, Ph.D. – Geographer. Each of us in education assembles, over time, a working list of “tried and true” technological tools, books, organizations, and other resources that enable us to be the most effective instructors we can be.
I too have assembled a list of the geospatial resources that have served me well in professional development workshops for educators as well as working directly with students from secondary to university level, in formal and informal settings, in the USA and internationally. Some are new, and some have been around awhile, but all have consistently been those resources that have fostered inquiry-driven, spatially-oriented, project-based education using GIS. And like yours, my “top 20” will be continually modified into the future.
Overview - geteach.com/maps. Trial. Viewer. Web Application. Web Application. Where do atheists live? Maps that show the UK's most 'godless' cities.