
Statisticians issue warning over misuse of P values. Misuse of the P value — a common test for judging the strength of scientific evidence — is contributing to the number of research findings that cannot be reproduced, the American Statistical Association (ASA) warns in a statement released today1.

The group has taken the unusual step of issuing principles to guide use of the P value, which it says cannot determine whether a hypothesis is true or whether results are important. This is the first time that the 177-year-old ASA has made explicit recommendations on such a foundational matter in statistics, says executive director Ron Wasserstein. The society’s members had become increasingly concerned that the P value was being misapplied in ways that cast doubt on statistics generally, he adds. In its statement, the ASA advises researchers to avoid drawing scientific conclusions or making policy decisions based on P values alone. How to interpret survey responses: 5 techniques: MeasuringU. Jeff Sauro • May 10, 2011 Closed ended rating scale data is easy to summarize and hard to interpret.
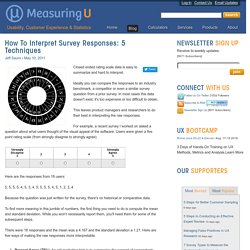
Ideally you can compare the responses to an industry benchmark, a competitor or even a similar survey question from a prior survey. In most cases this data doesn't exist, it's too expensive or too difficult to obtain. This leaves product managers and researchers to do their best in interpreting the raw responses. Weighted Average Standard Deviation. We recently found a way to calculate the standard deviation of weighted values on a Likert scale using Excel.

The three formulas involve first finding the weighted average score followed by variance and standard deviation. This was important because Excel does not provide a standard formula to find standard deviation with weighted values. Assuming that A1: A5 has the raw values and B1:B5 has the respective scores, the formulas are as follows: GraphPad - FAQ 1327 - The Mann-Whitney test doesn't really compare medians. You'll sometimes read that the Mann-Whitney test compares the medians of two groups.
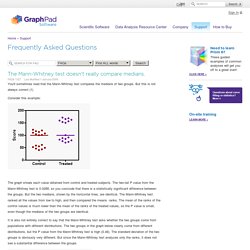
But this is not always correct (1) Consider this example: The graph shows each value obtained from control and treated subjects. Standard Error of the Mean in Google Sheets. Comparing the slopes for two independent samples. Doing a T-Test on the Slope Coefficient in Simple Regression. Free Online Statistics Calculators. Software. QuickCalcs Stat Calculator. Statistics Notes: Standard deviations and standard errors. Bar Graphs with Error Bars in Google Spreadsheet. Standard error of the mean. When you take a sample of observations from a population, the mean of the sample is an estimate of the parametric mean, or mean of all of the observations in the population.
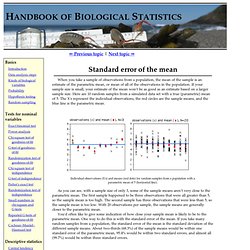
If your sample size is small, your estimate of the mean won't be as good as an estimate based on a larger sample size. Here are 10 random samples from a simulated data set with a true (parametric) mean of 5. Tutorials, Calculators, Consulting and Statistics Help. Critical Values of the Correlation Coefficient. Statistical significance of correlations. Statistical significance of correlations The chart below shows how large a correlation coefficient must be to be statistically significant.
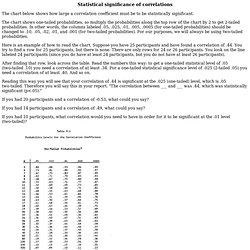
The chart shows one-tailed probabilities, so multiply the probabilities along the top row of the chart by 2 to get 2-tailed probabilities. In other words, the columns labeled .05, .025, .01, .005, .0005 (for one-tailed probabilities) should be changed to .10, .05, .02, .01, and .001 (for two-tailed probabilities). For our purposes, we will always be using two-tailed probabilities. Applets. This page contains applets from McClelland's Seeing Statistics, which have been integrated with material in Fundamental Statistics for the Behavioral Sciences, (5th edition) by David C.
Howell. You merely need to click on the appropriate link to open the applet, and then follow the directions on the page. These applets will run best if you have Sun's Java Virtual Machine installed on your computer. You can very easily download that software for free by going to clicking on the following image. Just follow their instructions. Chapter 4: Brightness Matching Experiment Chapter 5: Why Divide by N-1? Using a Critical Value Table for Pearson's r. Free p-Value Calculator for Correlation Coefficients. Statistics Tutorial - Choosing a T-Test. Explanation Paired or Independent t-test?
There are two types of t-test, the paired t-test and the independent t-test. This page tells you how to pick the right one for your data. We have already seen that when comparing two samples, it is important to know whether or not the samples are paired. The section on experimental design covers this in more detail, but here is a quick recap: With paired (dependent) samples, it is possible to take each measurement in one sample and pair it sensibly with one measurement in the other sample. One of the reasons that you need to identify the type of experimental design that you are dealing with is that you need to use the right t-test for the right design: The paired t-test is used when you have a paired designThe independent t-test is used when you have an independent designThat's easy enough. The other thing you need to decide at this point is easy to decide, but can be slightly harder to understand.