
This is why you shouldn’t believe that exciting new medical study. One.
But you'd never know that from reading the press. Take a recent miracle procedure for multiple sclerosis. MS is a degenerative disease with no cure. In sufferers, the immune system attacks the protective layer around the nerves, disturbing the communication between brain and body — and causing a cascade of devastating symptoms: unsteady and jerking movements; loss of vision, bladder and bowel control; and eventually, early death. In 2009, a breakthrough: a charming Italian researcher, Dr. Sadly, however, Zamboni's discovery was more hype than breakthrough.
"What makes it news is that it's new. ... This cycle recurs again and again. "There's a big, big, difference between how the media think about news and how scientists think about news," Naomi Oreskes, a Harvard professor of the history of science, recently told me in an interview. Most medical studies are wrong It’s a fact that all studies are biased and flawed in their own unique ways. What you need to earn to be considered Middle Class in every state.
Community college students more likely to fail online classes, but also graduate at higher rates. Why? Two weeks ago I wrote about the overwhelming research evidence that community college students aren’t doing as well in online classes as they are in face-to-face traditional classes.
Students are failing in higher numbers and getting lower grades. That remains true, but it isn’t the whole story. Peter Shea, who is the associate provost of online learning at the University of Albany SUNY, contacted me to share his research findings. Community college students who take online courses are more likely — 25 percent more likely to be exact — to complete their two-year associate’s degree or some sort of certificate than students who didn’t take any online classes. Not only are online course takers more likely to graduate, they’re more likely to graduate sooner than students who don’t take any online classes, Shea also found. “It’s a bit of a paradox,” said Shea. How can this be? The key to understanding this paradox is inside the registrar’s office. Not everyone is failing online courses. The Open Data Handbook. Goodbye, pie chart. @mccandelish explains how we can make better graphics. David McCandless does not like pie charts.
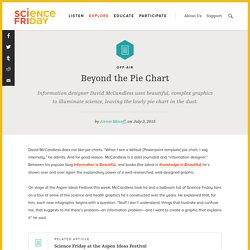
“When I see a default [Powerpoint template] pie chart, I sag internally,” he admits. And for good reason. McCandless is a data journalist and “information designer.” Between his popular blog Information is Beautiful, and books (the latest is Knowledge is Beautiful) he’s shown over and over again the explanatory power of a well-researched, well-designed graphic. On stage at the Aspen Ideas Festival this week, McCandless took Ira and a ballroom full of Science Friday fans on a tour of some of the science and health graphics he’s constructed over the years.
Related Article Science Friday at the Aspen Ideas Festival In the case of the infographic “Stellar Entities,” McCandless was frustrated with how we usually depict the cosmos: as uniform “points of light.” In the audio slideshow below, McCandless shows Ira how he transformed the Milky Way into a beautiful cosmic bouquet: Meet the Writer About Annie Minoff @annieminoff. Dear Romney Campaign, This Is How You Make a Venn Diagram. The Internet offers some helpful infographic hints -- but with an edge.

Upworthy On Tuesday, the Romney campaign tried, and failed, to create a Venn diagram. An infographic they distributed attacked President Obama's handling of health insurance, arguing that rising premiums showed he was hurting the middle class. As it happens, the message was misleading, for reasons explained by Washington Post Fact Checker Glenn Kessler in April. But it also wasn't really a Venn diagram. But while most of the Internet settled into its normal mode of mockery, Upworthy decided to be helpful, showing the Romney staff how a Venn diagram works. The Best Data Visualizations of 2013. FlowingData. Information is Beautiful.
Statistics images - Recherche sur Twitter. The Teaching and Learning of Statistics - International. This book presents the breadth and diversity of empirical and practical work done on statistics education around the world.
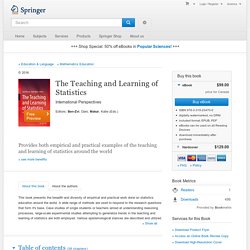
A wide range of methods are used to respond to the research questions that form it's base. Case studies of single students or teachers aimed at understanding reasoning processes, large-scale experimental studies attempting to generalize trends in the teaching and learning of statistics are both employed. Various epistemological stances are described and utilized. The teaching and learning of statistics is presented in multiple contexts in the book. These include designed settings for young children, students in formal schooling, tertiary level students, vocational schools, and teacher professional development. CAUSEweb.org.