
Cinq chiffres dingues sur nos usages des smartphones. Toutes ces vidéos de petits chats sur YouTube, ces selfies trop stylés sur Instagram, ces GIF hypnotiques regardés en boucle sur Twitter ou ces tchats sans fin sur Facebook : ça fait combien de données tout ça ?

Vous avez une vague idée au vu de votre abonnement mobile (3 gigaoctets par mois par exemple), sachant qu’en moyenne un client 3G ou 4G français consomme 1 Go selon le gendarme des télécoms [PDF, page 27]. Facebook’s $1.6 billion quarter in charts: how and where it makes money - Quartz. Facebook made $64 million (corrected; an earlier version of this story cited the operating profit, $523 million) on $1.585 billion in revenue in the fourth quarter of 2012, a result investors found somewhat disappointing.
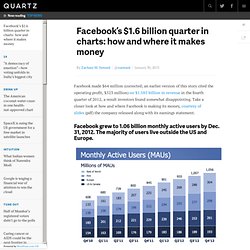
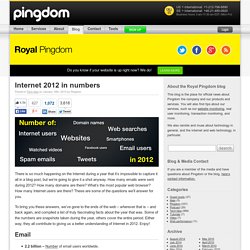
Take a closer look at how and where Facebook is making its money, courtesy of slides (pdf) the company released along with its earnings statement. Internet 2012 in numbers. Posted in Tech blog on January 16th, 2013 by Pingdom.
The top 100 sites on the internet. Explore this interactive graphic to find out which are the biggest sites on the internet, as measured by the Nielsen company.
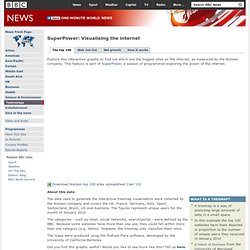
This feature is part of SuperPower, a season of programmes exploring the power of the internet. About this data The data used to generate the interactive treemap visualisation were collected by the Nielsen company and covers the UK, France, Germany, Italy, Spain, Switzerland, Brazil, US and Australia. The figures represent unique users for the month of January 2010. The categories - such as retail, social networks, search/portal - were defined by the BBC. The maps were produced using the Prefuse Flare software, developed by the University of California Berkeley.
Le Top 50 des sites d'infos en février. 30/10/10. We see a lot of metrics on web and mobile apps.
Our portfolio companies share their metrics with us, which we keep confidential and do not share with anyone outside of our firm. And companies that are seeking investment from USV also share their metrics with us. My Community Manager's Photos - Wall Photos. KPCB Top 10 Mobile Trends. State of the Internet: Summing up 2010 (Infographic) Royal Pingdom » Internet 2010 in numbers. Les 6 typologies d'internautes - Social Media, Social CRM, Community Management, Stratégie Internet par Cédric Deniaud. Internet Statistics & Social Media Usage. Accroche-toi au pinceau de la contribution, j?enl?ve l??chelle de la participation ? Article ? OWNI, Digital Journalism. Participer, collaborer, contribuer, le web 2.0 permet différents modes d'interaction.

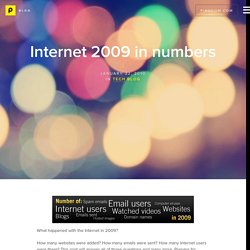
Mais depuis 2006, les comportements en ligne ont changé. Internet 2009 in numbers. What happened with the Internet in 2009?
World Internet Usage Statistics News and World Population Stats. CHART OF THE DAY: How People Share Content On The Web. Huge number of Web sites barely visited, report finds. Editor's Note: The following article is reprinted from TechWorld.
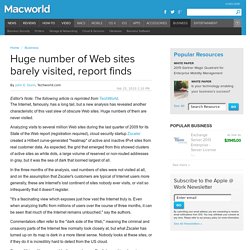
The Internet, famously, has a long tail, but a new analysis has revealed another characteristic of this vast slew of obscure Web sites. Huge numbers of them are never visited. The Rumors Are True: We Spend More And More Time Online. Survey results published by Harris Interactive suggest that adult Internet users are now spending an average of 13 hours a week online.

About 14% spends 24 or more hours a week online, while 20% of adult Internet users are online for only two hours or less a week. To put things in perspective: Harris surveyed 2,029 adults by telephone for an entire week in July and October 2009, and has been doing these types of polls since 1995. Harris concludes that the average hours spent online have increased from 7 hours from 1999 to 2002, to between 8 and 9 hours in 2003 to 2006, and surged after that. There was a sudden spike in time spent online in 2007 when the average hours spent on the Web increased to 11 hours. Last year, Internet users were online for 14 hours a week, double what it was from 1999 to 2002, although Harris says this could have something to do with the outbreak of the financial crisis and the lead-up to the presidential election in October 2008.
Kids' Media Use. Indicateurs de l'économie numérique en France_ACSEL. Introduction À l’occasion de la parution de ce premier baromètre, il convient de préciser la définition de l’ économie numérique élaborée par l’ACSEL, ainsi que son périmètre sectoriel.
La définition de l’économie n. Médias sociaux : usages & chiffres clés. Comportements médias - Les. Ce que représente vraiment Apple sur le marché. Mai252010 AT Internet évalue les parts de marché des OS en fonction des visites sur un panel de sites web surveillés, ce qui donne une vision assez réaliste de leur importance en Europe via la présence en ligne. Drowning by Numbers. Icons of the Web. December 18, 2013: The Nmap Project is pleased to release our new and improved Icons of the Web project! Since our free and open source Nmap Security Scanner software is all about exploring networks at massive scale, we started by scanning the top million web sites for 2013 (as ranked by the analytics company Alexa).
We then downloaded each site's favicon—the small icon displayed next to a site title in browser bookmarks and tabs. We scaled the icons in proportion to each site's monthly reach (popularity) and placed them in a giant collage. The smallest icons—for sites visited by only 0.00004% of the Internet population each month—are 256 pixels square (16x16). The largest icon (Google) is 394 million pixels. Four Lessons From Evernote’s First Week On The Mac App Store. Editor’s note: The following guest post is written by Phil Libin, CEO of Evernote, which is currently the No. 5 app in the Mac App Store. It also didn’t hurt that the app has been prominently featured by Apple. We just finished our first week on the Mac App Store and it might have been the most important week in Evernote’s history.