
Spurious Correlations. Plus.maths.org. Louisville TV News Data, Oct. 2012 - Google Tabellen. Statistics Tutorial. 15 best books to learn Probability. Probability theory is the mathematical study of uncertainty.
It plays a central role in machine learning, as the design of learning algorithms often relies on probabilistic assumption of the data. Roll Dice Online. Presentacion encuesta nacional salud mental 2015. Beginner's guide to R: Introduction. R is hot.
Whether measured by more than 4,400 add-on packages, the 18,000+ members of LinkedIn's R group or the close to 80 R Meetup groups currently in existence, there can be little doubt that interest in the R statistics language, especially for data analysis, is soaring. Why R? It's free, open source, powerful and highly extensible. "You have a lot of prepackaged stuff that's already available, so you're standing on the shoulders of giants," Google's chief economist told The New York Times back in 2009.
Because it's a programmable environment that uses command-line scripting, you can store a series of complex data-analysis steps in R. That also makes it easier for others to validate research results and check your work for errors -- an issue that cropped up in the news recently after an Excel coding error was among several flaws found in an influential economics analysis report known as Reinhart/Rogoff. Sure, you can easily examine complex formulas on a spreadsheet. Download RStudio – RStudio. Probability Tree Calculator - setup. Statistics support for students - www.statstutor.ac.uk. Pearson Product-Moment Correlation - When you should run this test, the range of values the coefficient can take and how to measure strength of association.
Online Statistics Education: A Free Resource for Introductory Statistics. Developed by Rice University (Lead Developer), University of Houston Clear Lake, and Tufts University.
Datos del Conflicto Armado en Colombia. En esta página CERAC pone a su disposición la Base de datos sobre Conflicto Armado Colombiano, y el glosario con la definición de cada una de las variables que la componen.
Contratación Mes de Junio 2016. UNITED STATES QuickFacts from the US Census Bureau. R news and tutorials contributed by (580) R bloggers. OpenIntro. OpenIntro… by David Diez et al. The mission of OpenIntro is to make educational products that are free, transparent, and lower barriers to education.
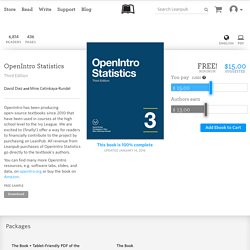
OpenIntro Statistics was our first project, and teachers have been using it in courses at community colleges to courses at Ivy League colleges. It is a world-class textbook that anyone can access, allowing students to focus on learning, not whether they can afford the book. Teachers can rest easy with our textbook, knowing that students can easily access the textbook before the course even starts,every student will have a copy of the textbook,FULL COLOR hardcover versions are available on Amazon for $24.99 (openintro.org/os/amazon),black-and-white paperbacks are on Amazon for $14.99,students will always have access to their course textbook, including future editions for free, andwe offer a variety of additional resources, including videos and software labs, for free on openintro.org.
Home. Stack Overflow. Standard Score - Definition of the Standard Score (Z-Score) Data, Probability and Statistics. Data, Probability and Statistics. EDRM611: Introduction to Statistics. When preparing your booklet for stapling, please check that you have all handouts and arrange them in the order above left to right, then top to bottom.
Grayed out and blacked out entries probably don't exist. R: The R Project for Statistical Computing. Basic Data Types. Calculating & Graphing Statistical Data. Why the Statistical Mean and Median of a Histogram Often Have Different Centers A histogram gives you a rough idea of where the "center" of the data lies.
The word center is in quotes because many different statistics are used to designate the center. The two most common measures [more…] How to Find the Interquartile Range for a Statistical Sample To obtain a measure of variation based on the five-number summary of a statistical sample, you can find what's called the interquartile range, or IQR. Statistics. How SPSS (Statistical Package for the Social Sciences) Works The developers of the Statistical Package for the Social Sciences (SPSS) made every effort to make the software easy to use.
This prevents you from making mistakes or even forgetting something. That's [more…] The Four Ways to Talk to SPSS. Statistics How To: Elementary Statistics for the rest of us! R Tutorial. R is a programming language and software environment for statistical analysis, graphics representation and reporting.
R was created by Ross Ihaka and Robert Gentleman at the University of Auckland, New Zealand, and is currently developed by the R Development Core Team. R is freely available under the GNU General Public License, and pre-compiled binary versions are provided for various operating systems like Linux, Windows and Mac. This programming language was named R, based on the first letter of first name of the two R authors (Robert Gentleman and Ross Ihaka), and partly a play on the name of the Bell Labs Language S. This tutorial is designed for software programmers, statisticians and data miners who are looking forward for developing statistical software using R programming.
Before proceeding with this tutorial, you should have a basic understanding of Computer Programming terminologies. . # Print Hello World.print("Hello World") # Add two numbers.print(23.9 + 11.6)