
Statistics for HCI Research: Statistics with Crosstab Tables. Introduction A crosstab table is probably the most common way to visualize the nominal (categorical) data.
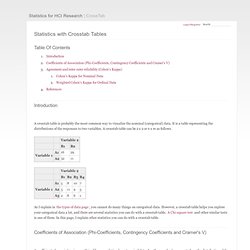
It is a table representing the distributions of the responses to two variables. A crosstab table can be 2 x 2 or n x m as follows. As I explain in the types of data page, you cannot do many things on categorical data. However, a crosstab table helps you explore your categorical data a lot, and there are several statistics you can do with a crosstab table. Coefficients of Association (Phi-Coefficients, Contingency Coefficients and Cramer's V) A coefficient of association is something like a correlation for categorical data. This crosstab table shows the distribution of the ownership of the two devices separated by users' ages. > data <- matrix(c(20, 10, 3, 27), ncol=2, byrow=T) > library(vcd) > assocstats(data) Statistics for HCI Research: Normality and Data transformation. Introduction Data transformation is a powerful tool when the data don't look like forming a normal distribution. The idea of data transformation is that you convert your data so that you can assume the normality and use parametric tests.
To determine whether we need any data transformation, we need to check the normality of the data. Although there are several statistical methods for checking the normality, what you should do is to look at a histogram and QQ-plot, and then run a test for checking the normality . Annotated Output of Proc Univariate. SAS Annotated Output Proc univariate Below is an example of code used to investigate the distribution of a variable.
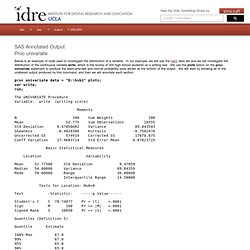
In our example, we will use the hsb2 data set and we will investigate the distribution of the continuous variable write, which is the scores of 200 high school students on a writing test. We use the plots option on the proc univariate statement to produce the stem-and-leaf and normal probability plots shown at the bottom of the output. We will start by showing all of the unaltered output produced by this command, and then we will annotate each section. proc univariate data = "D:\hsb2" plots; var write; run;
Rt.uits.iu.edu/visualization/analytics/docs/normality-docs/normality.pdf. Statwiki. Academic.csuohio.edu/kneuendorf/c63111/hand22.pdf. The CORR Procedure: Cronbach’s Coefficient Alpha. The CORR Procedure: Computing Cronbach’s Coefficient Alpha. Likert Scale – What is it? When to Use it? How to Analyze it? In all likelihood, you have used a Likert scale (or something you’ve called a Likert scale) in a survey before.
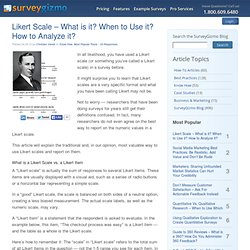
It might surprise you to learn that Likert scales are a very specific format and what you have been calling Likert may not be. Not to worry — researchers that have been doing surveys for years still get their definitions confused. In fact, many researchers do not even agree on the best way to report on the numeric values in a Likert scale. This article will explain the traditional and, in our opinion, most valuable way to use Likert scales and report on them. Analyzing Likert Data. Introduction Over the years, numerous methods have been used to measure character and personality traits (Likert, 1932).
The difficulty of measuring attitudes, character, and personality traits lies in the procedure for transferring these qualities into a quantitative measure for data analysis purposes. The recent popularity of qualitative research techniques has relieved some of the burden associated with the dilemma; however, many social scientists still rely on quantitative measures of attitudes, character and personality traits. In response to the difficulty of measuring character and personality traits, Likert (1932) developed a procedure for measuring attitudinal scales. The original Likert scale used a series of questions with five response alternatives: strongly approve (1), approve (2), undecided (3), disapprove (4), and strongly disapprove (5).
Statistics Roundtable: Likert Scales and Data Analyses. By I.
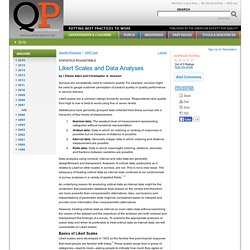
Elaine Allen and Christopher A. Seaman Surveys are consistently used to measure quality. For example, surveys might be used to gauge customer perception of product quality or quality performance in service delivery. Likert scales are a common ratings format for surveys. Wilcoxon. Introduction to social network analysis: Chapter 18: Some statistical tools. Introduction to social network methods 18.
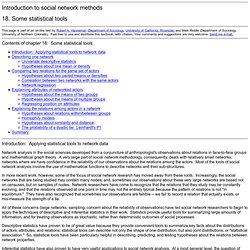
Some statistical tools.
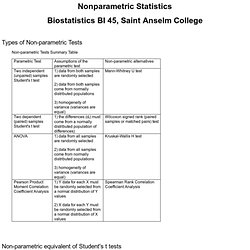
Nonparametric Statistics. Types of Non-parametric Tests Non-parametric Tests Summary Table Non-parametric equivalent of Student's t tests.
Www.stat.cmu.edu/~hseltman/309/Book/chapter16.pdf. Www.utdallas.edu/~herve/Abdi-PLS-pretty.pdf. Mediation (David A. Kenny) Some might benefit from Muthén (2011).
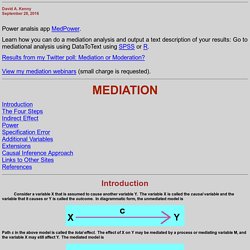
Note that both the CDE and the NDE would equal the regression slope or what was earlier called path c' if the model is linear, assumptions are met, and there is no XM interaction affecting Y, the NIE would equal ab, and the TE would equal ab + c'. In the case in which the specifications made by traditional mediation approach (e.g., linearity, no omitted variables, no XM interaction), the estimates would be the same. Analytics.ncsu.edu/sesug/2004/TU04-Pappas.pdf.
Www.math.wpi.edu/saspdf/stat/chap47.pdf.