
3 Ways to Detect Lying Data Visualizations. When it comes to data, a little bit of skepticism goes a long way.
People are often willing to accept sales performance statistics without thinking critically about the information or methodology behind the numbers. They’re even more willing to unquestioningly accept data that’s presented in the form of a pretty and easy-to-read chart. However, you should exercise caution. Numbers don’t always lie, but they can be manipulated or exaggerated. If someone wants to tweak a graphic to make the data look better or worse than it really is, it’s incredibly easy to do so. As a sales leader, you know how important it is to keep a careful eye on your team’s sales performance metrics. It’s the oldest trick in the book: change the values on the X or Y axis of a graph and make it look completely different. Statistics. A Good Example of Misleading Visualization. 5 Ways to Avoid Being Fooled By Statistics. Below is what SEO thought leader, Mike King (who happens to be my boss at iAcquire) tweeted a couple of months ago.
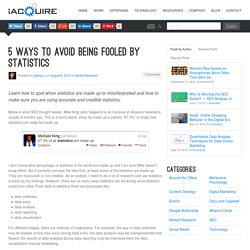
This is a funny tweet, since he made up a statistic “67.3%” to imply how statistics can really be made up. I don’t know what percentage of statistics in the world are made up and I am sure Mike doesn’t know either. But it correctly conveys the idea that, at least some of the statistics are made up. They are inaccurate or not credible. As an analyst, I need to do a lot of research and use statistics to back up my findings. Data collectiondata entrydata analysisdata reportingdata visualization For different stages, there are chances of malpractice. As a result, evaluating the accuracy, credibility and quality of the statistics provided by different sources has become my daily practice. First and foremost, change your mindset from taking the statistics as what they are to allowing enough skepticism to question the statistics you see. A Quick Guide to Spotting Graphics That Lie. Chiqui Esteban is the Deputy Director for Art, Maps, and Graphics at National Geographic magazine.
Data Points is a new series where we explore the world of data visualization, information graphics, and cartography. Numbers themselves don’t lie, but how we represent them can be really misleading. While charts and graphics can help us visualize large amounts of data, they can also be dangerous in the wrong hands. The good news first: If the chart is not plain lying, just playing with the way we perceive visual information, there are some tips you can use to reveal the truth.
The bad news is that you might have to do this analysis quickly if a chart flashes by quickly on a TV screen. If you want to detect a cheating chart, here’s a quick guide to the most common tricks: 1. This is probably the most common way graphics lie, whether intentional or not. It gets worse when we compare two different elements. That doesn’t mean that charts should never break a scale.
Finding Examples of Misleading and Deceptive Graphs. Infographics Lie. Here's How To Spot The B.S. We live in an age of Big: Big Computers, Big Data, and Big Lies.

Faced with an unprecedented torrent of information, data scientists have turned to the visual arts to make sense of big data. The result of this unlikely marriage–often called “data visualizations” or “infographics”–has repeatedly provided us with new and insightful perspectives on the world around us. However, time and time again we have seen that data visualizations can easily be manipulated to lie. By misrepresenting, altering, or faking the data they visualize, data scientists can twist public opinion to their benefit and even profit at our expense. We have a natural tendency to trust images more than text. 1. The subtlest way a data visualization can fool you is by using visual cues to make data stand out that normally wouldn’t.
Color cues Color is one popular tool for making certain data stand out above the rest. Make sure to look at what the colors actually represent before drawing a conclusion from the visualization.