
An Open Source Software Library for Machine Intelligence. Deepframeworks/README.md at master · zer0n/deepframeworks. Training - Bioinformatics Core Wiki. BIST "Introduction to Biostatistics" Course Course Description This introductory course to statistics and probability theory is modeled after the traditional university course Statistics 101 and will be given by the CRG staff and PhD students.

The material is offered in 5 consecutive modules (please see Course Syllabus below), each containing a morning lecture and an afternoon practicum in a computer class. For practical exercises we will use R programming language and R Studio. However, this course is focused on statistics rather than R; therefore, each practicum is designed with the purpose to demonstrate and reinforce understanding of concepts introduced in the lecture rather than to provide a training in R.
Table Browser. Use this program to retrieve the data associated with a track in text format, to calculate intersections between tracks, and to retrieve DNA sequence covered by a track.
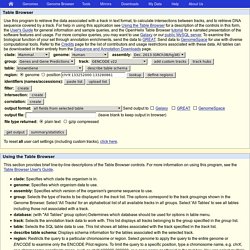
For help in using this application see Using the Table Browser for a description of the controls in this form, the User's Guide for general information and sample queries, and the OpenHelix Table Browser tutorial for a narrated presentation of the software features and usage. For more complex queries, you may want to use Galaxy or our public MySQL server. To examine the biological function of your set through annotation enrichments, send the data to GREAT. Bridgecrest Bioinformatics: The Use of Log-Log plots to show technical reproducibility of NGS data. Reproducibility, the ability for the same input to produce the same output, is an important concept in the sciences.
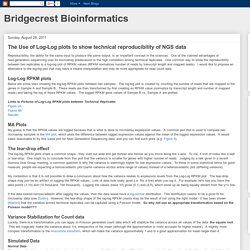
One of the claimed advantages of next-generation sequencing over its microarray predecessor is the high correlation among technical replicates. GraphPad Statistics Guide. Cluster analysis - differences in heatmap/clustering defaults in R (heatplot versus heatmap.2)? User: Pierre Lindenbaum. Major Exome Platforms Compared. UCSC Genome Bioinformatics: FAQ. Question: "What has UCSC done to accommodate the changes to display IDs recently introduced by UniProt (aka Swiss-Prot/TrEMBL)?
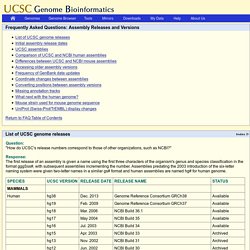
" Response: Here is a detailed description of the database changes we have made to accommodate the UniProt changes. If you are using the proteinID field in our knownGene table or the Swiss-Prot/TrEMBL display ID for indexing or cross-referencing other data, we strongly suggest you transition to the UniProt accession number. These changes will also affect anyone who is mirroring our site. The latest UniProt Knowledgebase (Release 46.0, Feb. 1st, 2005) was parsed and the results were stored in a newly created database sp050201. A corresponding database, proteins050201, was constructed based on data in sp050201 and other protein data sources. We anticipate additional changes down the road and may eventually merge the two sets of protein DB pointers into one set. Data visualization - How to determine best cutoff point and its confidence interval using ROC curve in R? Calculating precision and recall in R.
Canopy Dynamics Lab Software. RPubs. Statistics Archives - Musings from an unlikely candidateMusings from an unlikely candidate. Generalized Additive Models in R. Generalized additive models in R GAMs in R are a nonparametric extension of GLMs, used often for the case when you have no a priori reason for choosing a particular response function (such as linear, quadratic, etc.) and want the data to 'speak for themselves'.
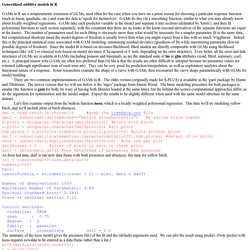
GAMs do this via a smoothing function, similar to what you may already know about locally weighted regressions. R - Shading a kernel density plot between two points. Fitting empirical distributions to theoretical models. R - Plot probability with ggplot2 (not density) Square Goldfish » R, the acf function and statistical significance. The R language provides us with a useful method to calculate the autocorrelation function (ACF) of a time series.
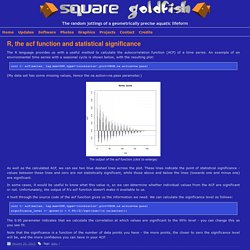
An example of an environmental time series with a seasonal cycle is shown below, with the resulting plot: corr <- acf(series, lag.max=288,type="correlation",plot=TRUE,na.action=na.pass) (My data set has some missing values, hence the na.action=na.pass parameter.) The output of the acf function (click to enlarge) As well as the calculated ACF, we can see two blue dashed lines across the plot. In some cases, it would be useful to know what this value is, so we can determine whether individual values from the ACF are significant or not. A hunt through the source code of the acf function gives us the information we need. Corr <- acf(series, lag.max=288,type="correlation",plot=TRUE,na.action=na.pass) significance_level <- qnorm((1 + 0.95)/2)/sqrt(sum(! Machine learning - WEKA LibSVM weight parameter for cost. Statistica con R: ANOVA a due vie. L'analisi della varianza ad una via è utile per verificare contemporaneamente se le medie di più gruppi sono uguali.
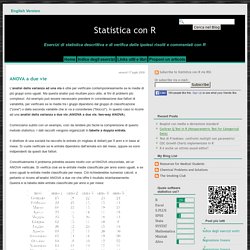
Ma questa analisi può risultare poco utile, ai fini di problemi più complessi. Ad esempio può essere necessario prendere in considerazione due fattori di variabilità, per verificare se le medie tra i gruppi dipendono dal gruppo di classificazione ("zone") o dalla seconda variabile che si va a considerare ("blocco"). An R Introduction to Statistics. Using R for Multivariate Analysis — Multivariate Analysis 0.1 documentation.