
Data Analysis - Pearson's Correlation Coefficient. Post Hoc Statistical Procedures: - Effect Size Calculators (Lee Becker) Logical Causation. Correlation and Causation: We experience the world in a time-oriented manner through cause and effect.
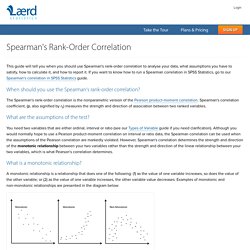
First Lucy ate that white berry, then she became sick. First I hit Bob's foot with a hammer, then his foot swelled with a purple bruise. I conclude that eating the white berry is what actually made Lucy sick later. I conclude that being hit with a hammer is what later caused Bob's foot to swell. Spearman's Rank Order Correlation using SPSS Statistics - A How-To Statistical Guide by Laerd Statistics. Introduction The Spearman rank-order correlation coefficient (Spearman’s correlation, for short) is a nonparametric measure of the strength and direction of association that exists between two variables measured on at least an ordinal scale. It is denoted by the symbol rs (or the Greek letter ρ, pronounced rho). The test is used for either ordinal variables or for continuous data that has failed the assumptions necessary for conducting the Pearson's product-moment correlation.
For example, you could use a Spearman’s correlation to understand whether there is an association between exam performance and time spent revising; whether there is an association between depression and length of unemployment; and so forth. If you would like some more background on this test, you can find it here. This "quick start" guide shows you how to carry out a Spearman’s correlation using SPSS Statistics. SPSS Statisticstop ^ PreMBA Analytical Methods. Covariance and correlation describe how two variables are related.
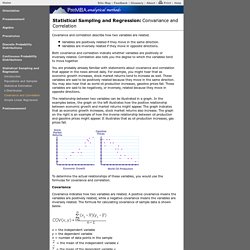
Variables are positively related if they move in the same direction. Variables are inversely related if they move in opposite directions. Both covariance and correlation indicate whether variables are positively or inversely related. Correlation also tells you the degree to which the variables tend to move together. You are probably already familiar with statements about covariance and correlation that appear in the news almost daily. Spearman's Rank-Order Correlation - A guide to when to use it, what it does and what the assumptions are. This guide will tell you when you should use Spearman's rank-order correlation to analyse your data, what assumptions you have to satisfy, how to calculate it, and how to report it.
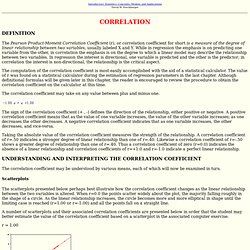
If you want to know how to run a Spearman correlation in SPSS Statistics, go to our guide here. Correlation. When two sets of data are strongly linked together we say they have a High Correlation.
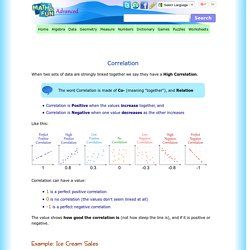
The word Correlation is made of Co- (meaning "together"), and Relation Correlation is Positive when the values increase together, and Correlation is Negative when one value decreases as the other increases Like this: Correlation. Correlation. Introductory Statistics: Concepts, Models, and Applications David W.
Stockburger The Pearson Product-Moment Correlation Coefficient (r), or correlation coefficient for short is a measure of the degree of linear relationship between two variables, usually labeled X and Y. While in regression the emphasis is on predicting one variable from the other, in correlation the emphasis is on the degree to which a linear model may describe the relationship between two variables.
In regression the interest is directional, one variable is predicted and the other is the predictor; in correlation the interest is non-directional, the relationship is the critical aspect. Correlation (I) Correlation Association Between Variables Prerequisites Before reading this tutorial, you should already be familiar with the concepts of an arithmetic mean, a z-score, and a regression line.
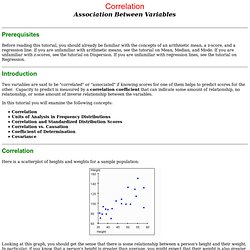
If you are unfamiliar with arithmetic means, see the tutorial on Mean, Median, and Mode. Statistical significance of correlations. Statistical significance of correlations The chart below shows how large a correlation coefficient must be to be statistically significant.
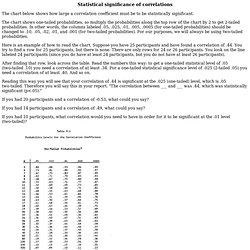
The chart shows one-tailed probabilities, so multiply the probabilities along the top row of the chart by 2 to get 2-tailed probabilities. In other words, the columns labeled .05, .025, .01, .005, .0005 (for one-tailed probabilities) should be changed to .10, .05, .02, .01, and .001 (for two-tailed probabilities). Good examples of: Correlation doesn't prove Causation. Quote: Even if this is true (and i doubt it is) it remains a perfect example of a causative effect.
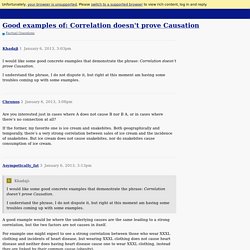
Causative effects don't have to be direct to be causative. In both science and law, what you just described is known as a proximate cause. It's a cause that is directly linked to, and directly causative of, the immediate cause. Oreos are as enticing as cocaine, a rat study finds. But don’t worry about withdrawal. Are Oreos as addictive as cocaine?
A new study purports to draw a link, but don’t check into a treatment center for your Double Stuf addiction just yet. Following a Connecticut College press release on an undergraduate student research project, a number of headlines have blared warnings such as “Oreos May Be as Addictive as Cocaine” (Time) and “College study finds Oreo cookies are as addictive as drugs” (Fox News).
The research behind the headlines is not quite so certain, however. According to the college, student researchers put rats in a maze with two sides. On one side, the rats were rewarded for traversing the maze with delicious, sugary Oreos. Unsurprisingly, the Oreos were more popular than the rice cakes. THE DREAD TOMATO ADDICTION. Ninety-two point four per cent of juvenile delinquents have eaten to- matoes.

Eighty-seven point one per cent of the adult criminals in penitentiaries throughout the United States have eaten tomatoes. Informers reliably inform that of all known American Communists ninety-two point three per cent have eaten tomatoes. Eighty-four per cent of all people killed in automobile accidents during the year 1954 had eaten tomatoes. Those who object to singling out specific groups for statistical proofs require measurements within in the total. Of those people born before the year 1800, regardless of race, color, creed or caste, and known to have eaten tomatoes, there has been one hundred per cent mortality!
* It is suggested that best results will be obtained by using an experimental subject who is thoroughly familiar with and frequently uses the logical methods demonstrated herein, such as: (a) The average politician. This was originally published in the February 1958 edition of Astounding. The Correlation Coefficient - Part 1. Yet More Proof That Violent Videogames Don't Cause Aggression. Correlations. Correlated Observations.