
Quantile Regression - Econometrics Academy. Monte Carlo Simulation Basics. [ Preface ] [ Sales Forecast Example ] A Monte Carlo method is a technique that involves using random numbers and probability to solve problems.
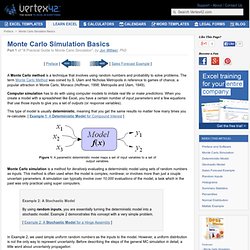
The term Monte Carlo Method was coined by S. Ulam and Nicholas Metropolis in reference to games of chance, a popular attraction in Monte Carlo, Monaco (Hoffman, 1998; Metropolis and Ulam, 1949). Computer simulation has to do with using computer models to imitate real life or make predictions. This type of model is usually deterministic, meaning that you get the same results no matter how many times you re-calculate. [ Example 1: A Deterministic Model for Compound Interest ] Figure 1: A parametric deterministic model maps a set of input variables to a set of output variables.
Monte Carlo simulation is a method for iteratively evaluating a deterministic model using sets of random numbers as inputs. In Example 2, we used simple uniform random numbers as the inputs to the model. Uncertainty Propagation If you have made it this far, congratulations! Power Analysis. Overview Power analysis is an important aspect of experimental design.

It allows us to determine the sample size required to detect an effect of a given size with a given degree of confidence. Conversely, it allows us to determine the probability of detecting an effect of a given size with a given level of confidence, under sample size constraints. If the probability is unacceptably low, we would be wise to alter or abandon the experiment. The following four quantities have an intimate relationship: How To Determine Sample Size, Determining Sample Size. In order to prove that a process has been improved, you must measure the process capability before and after improvements are implemented.

This allows you to quantify the process improvement (e.g., defect reduction or productivity increase) and translate the effects into an estimated financial result – something business leaders can understand and appreciate. If data is not readily available for the process, how many members of the population should be selected to ensure that the population is properly represented? If data has been collected, how do you determine if you have enough data? Determining sample size is a very important issue because samples that are too large may waste time, resources and money, while samples that are too small may lead to inaccurate results. In many cases, we can easily determine the minimum sample size needed to estimate a process parameter, such as the population mean When sample data is collected and the sample mean .
Where: is the sample size. to within . . Logistic Regression. Preliminaries Model Formulae You will need to know a bit about Model Formulae to understand this tutorial.
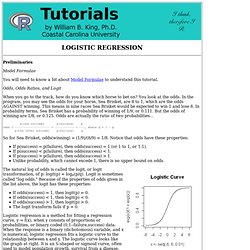
Odds, Odds Ratios, and Logit When you go to the track, how do you know which horse to bet on? You look at the odds.
The p value and the base rate fallacy. You’ve already seen that p values are hard to interpret.
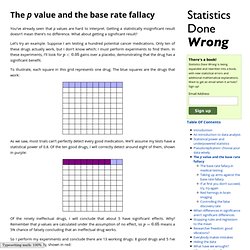
Getting a statistically insignificant result doesn’t mean there’s no difference. What about getting a significant result? Let’s try an example. Suppose I am testing a hundred potential cancer medications. Only ten of these drugs actually work, but I don’t know which; I must perform experiments to find them. To illustrate, each square in this grid represents one drug. As we saw, most trials can’t perfectly detect every good medication. Of the ninety ineffectual drugs, I will conclude that about 5 have significant effects. So I perform my experiments and conclude there are 13 working drugs: 8 good drugs and 5 I’ve included erroneously, shown in red: The chance of any given “working” drug being truly effectual is only 62%.
Because the base rate of effective cancer drugs is so low – only 10% of our hundred trial drugs actually work – most of the tested drugs do not work, and we have many opportunities for false positives. Chi Square Test of Independence. Syntax From the help page, the syntax of the chisq.test( ) function is... chisq.test(x, y = NULL, correct = TRUE, p = rep(1/length(x), length(x)), rescale.p = FALSE, simulate.p.value = FALSE, B = 2000) This function is used for both the goodness of fit test and the test of independence, and which test it does depends upon what kind of data you feed it.
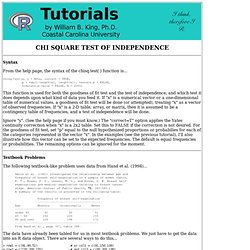
If "x" is a numerical vector or a one-dimensional table of numerical values, a goodness of fit test will be done (or attempted), treating "x" as a vector of observed frequencies. If "x" is a 2-D table, array, or matrix, then it is assumed to be a contingency table of frequencies, and a test of independence will be done. Ignore "y". Textbook Problems The following textbook-like problem uses data from Hand et al. (1994)... Senie et al. (1981) investigated the relationship between age and frequency of breast self-examination in a sample of women (Senie, R.
The data have already been tabled for us in most textbook problems. The p value and the base rate fallacy. How to calculate pseudo-$R^2$ from R's logistic regression.