
Applied Econometrics at the University of Illinois: e-Tutorial 8: Granger Causality. Econometrics Beat: Dave Giles' Blog: VAR or VECM When Testing for Granger Causality? It never ceases to amaze me that my post titled "How Many Weeks are There in a Year?
" is at the top of my all-time hits list! Interestingly, the second-placed post is the one I titled "Testing for Granger Causality". Let's call that one the number one serious post. As with many of my posts, I've received quite a lot of direct emails about that piece on Granger causality testing, in addition to the published comments.
One question that has come up a few times relates to the use of a VAR model for the levels of the data as the basis for doing the non-causality testing, even when we believe that the series in question may be cointegrated. On the face of it, this might seem like a good idea. First, let's recall the main message from my earlier post. "X is said to Granger-cause Y if Y can be better predicted using the histories of both X and Y than it can by using the history of Y alone. " Stata features. Annotated Stata Output: MANOVA. Stata Annotated Output MANOVA This page shows an example of multivariate analysis of variance (MANOVA) in Stata with footnotes explaining the output.
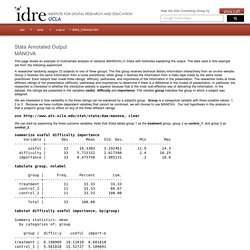
The data used in this example are from the following experiment. A researcher randomly assigns 33 subjects to one of three groups. The first group receives technical dietary information interactively from an on-line website. Group 2 receives the same information from a nurse practitioner, while group 3 receives the information from a video tape made by the same nurse practitioner. We are interested in how variability in the three ratings can be explained by a subject's group. Use clear We can start by examining the three outcome variables. Summarize useful difficulty importance Variable | Obs Mean Std. Next, we can enter our MANOVA command. Jobs. Data Analysis. Oscar Torres-Reyna DSS Data Consultant Finding the question is often more important than finding the answer John Tukey I do not understand the output of my regression!!!
Is my model OK? How to create dummies Making publication-style tables in STATA How can I create variables containing percent summaries? Topics in Statistics Stata Library. Online Training Section at DSS BOOK: Stock, James H. and Mark Watson, Introduction to Econometrics, Addison Wesley, 2003. A very general guideline Once you define the question and, hopefully, have a clear idea of what you want to know you can proceed to apply the statistical technique suitable for your data. At first you need to answer two questions: 1. 2. There is no a straight answer on what kind of technique you need to use for your data. 1. 2.
RSS SPSS Short Course Module 9 Principal Components Analysis 1. Principal Components Analysis in SPSS.
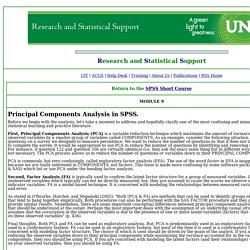
Before we begin with the analysis; let's take a moment to address and hopefully clarify one of the most confusing and misarticulated issues in statistical teaching and practice literature. First, Principal Components Analysis (PCA) is a variable reduction technique which maximizes the amount of variance accounted for in the observed variables by a smaller group of variables called COMPONENTS. As an example, consider the following situation. Let's say, we have 500 questions on a survey we designed to measure persistence. We want to reduce the number of questions so that it does not take someone 3 hours to complete the survey. PCA is commonly, but very confusingly, called exploratory factor analysis (EFA).
Second, Factor Analysis (FA) is typically used to confirm the latent factor structure for a group of measured variables. Final thoughts. Principal Components Analysis. Halle Institute for Economic Research. 1.
General Information When are internships available? The IWH offers opportunities to complete internships at any times. Dates are arranged individually. In which department may I intern? Interns are affiliated with one of our research departments and work within a research group, where they will be coached by an IWH employee. What kind of work can students expect? Generalized method of moments. In econometrics, the generalized method of moments (GMM) is a generic method for estimating parameters in statistical models.
Usually it is applied in the context of semiparametric models, where the parameter of interest is finite-dimensional, whereas the full shape of the distribution function of the data may not be known, and therefore the maximum likelihood estimation is not applicable. The GMM estimators are known to be consistent, asymptotically normal, and efficient in the class of all estimators that don’t use any extra information aside from that contained in the moment conditions. Description[edit] Suppose the available data consists of T observations {Yt } t = 1,...,T, where each observation Yt is an n-dimensional multivariate random variable. A general assumption of GMM is that the data Yt be generated by a weakly stationary ergodic stochastic process. In order to apply GMM, we need to have "moment conditions", i.e. we need to know a vector-valued function g(Y,θ) such that.