
The Steve Harvey Talk Show. Machine Learning. Log into your Stanford Online Account. Log into your Stanford Online Account. (ML 12.6) Cross-validation (part 2) (ML 12.7) Cross-validation (part 3) (ML 12.3) Model complexity parameters. Stress Less: An IQ Matrix Example. Image Result for. Y&R Group Switzerland -Y&R Group Switzerland. How to Think Like a Computer Scientist — How to Think Like a Computer Scientist: Learning with Python 3.
Version date: October 2012 by Peter Wentworth, Jeffrey Elkner, Allen B.
Downey, and Chris Meyers (based on 2nd edition by Jeffrey Elkner, Allen B. Downey, and Chris Meyers) Corresponding author: p.wentworth@ru.ac.za Source repository is at For offline use, download a zip file of the html or a pdf version (the pdf is updated less often) from Search PageCopyright NoticeForewordPrefacePreface-3 This Rhodes Local Edition (RLE) of the bookContributor ListChapter 1 The way of the programChapter 2 Variables, expressions, and statementsChapter 3 Hello, little turtles!
Hash function. A hash function that maps names to integers from 0 to 15.
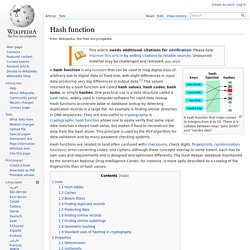
There is a collision between keys "John Smith" and "Sandra Dee". Uses[edit] Hash tables[edit] Thus, the hash function only hints at the record's location — it tells where one should start looking for it. Still, in a half-full table, a good hash function will typically narrow the search down to only one or two entries. Caches[edit] Bloom filters[edit] Main article: Bloom filter Finding duplicate records[edit] Protecting data[edit] A hash value can be used to uniquely identify secret information. Finding similar records[edit] Hash functions can also be used to locate table records whose key is similar, but not identical, to a given key; or pairs of records in a large file which have similar keys. This class includes the so-called acoustic fingerprint algorithms, that are used to locate similar-sounding entries in large collection of audio files. Neural Networks for Machine Learning {c}
Sina Visitor System. (ML 12.2) Bias-variance in model selection. (ML 12.5) Cross-validation (part 1) Understanding the Bias-Variance Tradeoff. Understanding the Bias-Variance Tradeoff June 2012 When we discuss prediction models, prediction errors can be decomposed into two main subcomponents we care about: error due to "bias" and error due to "variance".
There is a tradeoff between a model's ability to minimize bias and variance. Understanding these two types of error can help us diagnose model results and avoid the mistake of over- or under-fitting. Understanding how different sources of error lead to bias and variance helps us improve the data fitting process resulting in more accurate models. Conceptual Definition Error due to Bias: The error due to bias is taken as the difference between the expected (or average) prediction of our model and the correct value which we are trying to predict.
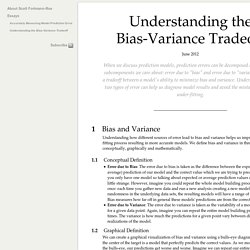
Graphical Definition We can create a graphical visualization of bias and variance using a bulls-eye diagram. We can plot four different cases representing combinations of both high and low bias and variance. Mathematical Definition. Description and Tutorial. Principal Component Analysis 4 Dummies: Eigenvectors, Eigenvalues and Dimension Reduction. Having been in the social sciences for a couple of weeks it seems like a large amount of quantitative analysis relies on Principal Component Analysis (PCA).

This is usually referred to in tandem with eigenvalues, eigenvectors and lots of numbers. So what’s going on? Is this just mathematical jargon to get the non-maths scholars to stop asking questions? Maybe, but it’s also a useful tool to use when you have to look at data. This post will give a very broad overview of PCA, describing eigenvectors and eigenvalues (which you need to know about to understand it) and showing how you can reduce the dimensions of data using PCA. There’s quite a bit of stuff to process in this post, but i’ve got rid of as much maths as possible and put in lots of pictures. Taylor Series. Introduction to Principal Component Analysis (PCA) - Laura Diane Hamilton. Principal Component Analysis (PCA) is a dimensionality-reduction technique that is often used to transform a high-dimensional dataset into a smaller-dimensional subspace prior to running a machine learning algorithm on the data.
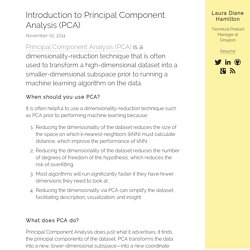
When should you use PCA? It is often helpful to use a dimensionality-reduction technique such as PCA prior to performing machine learning because: Reducing the dimensionality of the dataset reduces the size of the space on which k-nearest-neighbors (kNN) must calculate distance, which improve the performance of kNN. Reducing the dimensionality of the dataset reduces the number of degrees of freedom of the hypothesis, which reduces the risk of overfitting. Most algorithms will run significantly faster if they have fewer dimensions they need to look at. What does PCA do? Principal Component Analysis does just what it advertises; it finds the principal components of the dataset. Can you ELI5? Let’s say your original dataset has two variables, x1 and x2: