
ISM Report on Business - Highly Reliable Economic Indicators: Manufacturing PMI, Services PMI, and Hospital PMI. Mid-American Economy Reports - Creighton University - Monthly Survey of Supply Managers and Procurement Experts in Mid-America states. Business Spend Management (BSM) Platform. The Coupa BSI is a leading indicator of potential economic growth based on current business spending decisions of hundreds of businesses.
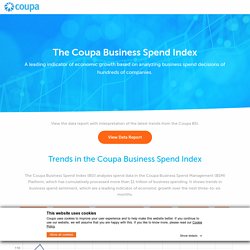
It analyzes transactions from the Coupa BSM Platform, which has cumulatively processed more than $1 trillion of business spending, to measure confidence around economic growth at an aggregate level, as well as an industry level within financial services, health and life sciences, high tech, manufacturing, and retail. The index is based on three key spend factors at a business: (1) average spend per person, (2) average time to approve spend decisions, and (3) average rate of spend approval/rejection. Middle Market Indicator - Key indicators of America’s Middle Market Companies - Performance in Revenues, Employment, and Allocation of Cash. The Conference Board Economic Indicators. Economic Data & Analysis Keep up with the numbers that matter most. Creighton University Mid-America Business Conditions Index. January survey highlights: The overall index moved above growth neutral for the third time in the past four months, rising to its highest reading since March 2019.Hiring index rose above growth neutral.

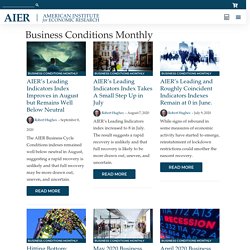
January passage of the USMCA and Phase 1 of the Chinese trade agreement boosted the regional business confidence index. Approximately 56% expect signing of USMCA and Phase 1 of the Chinese agreement to have a positive impact on business prospects. Due to the trade war, 28.2% of supply managers report changing international vendors for purchases. Business Conditions Monthly – American Institute of Economic Research. Download and Read “A Scientist’s Plea” from AIER Download the Plea!
D&B U.S. Business Economic Trends, Health Index. A monthly report on business-related economic trends December 2016 Report Dun & Bradstreet's U.S.
Economic Health Tracker is a monthly, multi-dimensional review of the health of the economy. Read and download the latest report for key insight on small business, jobs, and overall business performance. Come back regularly for new updates, published the Tuesday prior to the first Friday of each month. Perspectives. CEO Confidence Index. Creighton University Mid-America Business Conditions Index. Ivey Purchasing Managers Index (PMI) The PMI is provided in two formats, unadjusted and seasonally adjusted.
It shows responses to one question:"Were your purchases last month in dollars higher, the same, or lower than the previous month? " A figure above 50 shows an increase while below 50 shows a decrease. The Ivey PMI measures month to month changes in dollars of purchases as indicated by a panel of purchasing managers have been carefully selected geographically and by sector of activity to match the Canadian economy as a whole. The PMI includes both the public and private sectors and is based on month end data Ivey PMI panel members indicate whether their organizations activity is higher than, the same as, or lower than the previous month across the following five categories: purchases, employment, inventories, supplier deliveries and prices. Please see our homepage for the current month's results.
REALTORS® Confidence Index. Download (PDF: 1.37 MB) The REALTORS® Confidence Index (RCI) survey gathers on-the-ground information from REALTORS® based on their real estate transactions in the month.

This report presents key results about July 2020 market transactions. Several metrics indicate the continued rebound of the housing market in July. The REALTORS® Buyer Traffic Index improved in July to 71 (moderately strong conditions) after reaching 50 (stable conditions) in May. First-time buyers accounted for 34% of existing home sales. Note: the REALTOR® Confidence Index is provided by NAR solely for use as a reference. Europe Economic Trends EUROSTAT. Employment Trends Index™ (ETI)
The Conference Board Employment Trends Index™ (ETI) An aggregate of eight labor-market indicators that shows underlying trends in employment conditions.

Data series: 1973 – present. 06 Apr. 2020 Download complete press release. Rail Traffic Data - Association of American Railroads. The Big Mac index - Burgernomics. Get our daily newsletter Upgrade your inbox and get our Daily Dispatch and Editor's Picks. THE Big Mac index was invented by The Economist in 1986 as a lighthearted guide to whether currencies are at their “correct” level.
The Fed - Industrial Production and Capacity Utilization - G.17. Current Release PDF ASCII RSS DDP Release Date: May 16, 2017 Industrial production advanced 1.0 percent in April for its third consecutive monthly increase and its largest gain since February 2014.
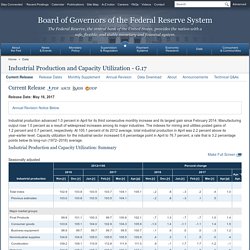
Manufacturing output rose 1.0 percent as a result of widespread increases among its major industries. The indexes for mining and utilities posted gains of 1.2 percent and 0.7 percent, respectively. At 105.1 percent of its 2012 average, total industrial production in April was 2.2 percent above its year-earlier level. Industrial Production and Capacity Utilization: Summary Make Full Screen. Consumer Price Index (CPI) The Consumer Price Indexes (CPI) program produces monthly data on changes in the prices paid by urban consumers for a representative basket of goods and services.
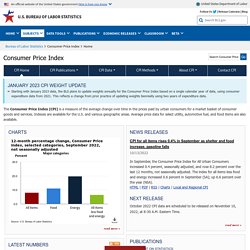
Announcements IMPORTANT The CPI Detailed Report will cease publication after June 2017. The June 2017 version of the report, which will be published in July 2017, will be the final publication of this document. Customers are encouraged to obtain CPI data from the CPI databases or the Supplemental Files. Each year with the release of the January CPI, seasonal adjustment factors are recalculated to reflect price movements from the just-completed calendar year. Next Release: April 2017 CPI data are scheduled to be released on May 12, 2017, at 8:30 A.M. Prices - Inflation (CPI)
Inflation measured by consumer price index (CPI) is defined as the change in the prices of a basket of goods and services that are typically purchased by specific groups of households.
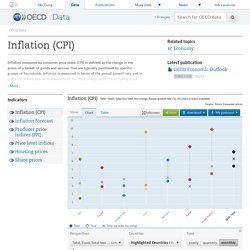
Inflation is measured in terms of the annual growth rate and in index, 2010 base year with a breakdown for food, energy and total excluding food and energy. BLS - Various Databases, Tables by Subject. Gallup Topic. NFIB Small Business Optimism Index. Supply Chain Index — Supply Chain Insights. The Supply Chain Index™ is designed to be used as a ranking system and benchmarking tool. It enables companies to better understand the relationship between supply chain and financial (market capitalization) performance and to define what metrics correlate strongly with market capitalization growth.
In addition, the Index enables us to identify if there are metrics that matter to a supply chain but not to a market capitalization perspective. What industries or companies have the strongest relationship between supply chain and market capitalization and what can we learn from them? Can supply chain performance in one year help to predict market capitalization trends in the future? These questions and many, many more are useful in increasing our understanding of supply chain excellence and at a practical level, serving as benchmarks for understanding what success looks like in your supply chain.
Purchasing Managers' Index (PMI) - The Chartered Institute of Procurement and Supply. Give your procurement teams the most up-to-the-minute data with the UK IHS Markit/CIPS Purchasing Managers’ indices (PMIs) - a highly accurate set of facts about current industry conditions in manufacturing, construction and services. Purchasing professionals know the importance of having timely, reliable and regular data to guide their decision making. Published monthly, PMIs are a set of surveys from selected companies which provide a summary of general business and economic conditions in the private sector. They will offer invaluable guidance to your purchasing team, your CEO and Board, helping them to gauge general price trends, assess supplier delivery times, support them in negotiations with suppliers and use as benchmarking tools.
We publish all PMIs in the CIPS news section of our website and share the results on our social media channels, so follow us if you want to keep up to date. Services producer price index overview - Statistics Explained. Data from April 2017. Most recent data: Further Eurostat information, Main tables and Database. Coindesk - Bitcoin, Ethereum Price Index. Price 24 Hour % Change Market Cap Supply 1h6h12h1d1w1m3m6m1yall 24 Hour Activity 24 Hour Low 24 Hour High Net change.