
Remote Sensing of Water. Whether you consider the accelerated glacial melt caused by global warming, the eutrophication of regional lakes and reservoirs from urban and agricultural runoff, or the loss of wetlands through urban expansion and climate change, the impact of human activities on the quality of water resources is pervasive.
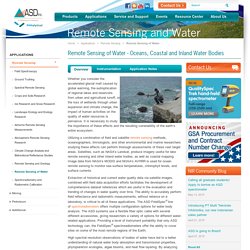
It is necessary to study the importance of these effects and the resulting vulnerability of the earth’s entire ecosystem. Utilizing a combination of field and satellite remote sensing methods, oceanographers, limnologists, and other environmental and marine researchers studying these effects can perform thorough assessments of these vast target areas. Satellites, such as NASA’s Landsat, produce imagery useful for lake remote sensing and other inland water bodies, as well as coastal mapping. Image data from NASA’s MODIS and NOAA’s AVHRR is used for ocean remote sensing to monitor sea surface temperatures, chlorophyll levels, and surface currents. General Registration and Login. In order to provide a unique username and password for all EO services available on the web, ESA has created the Earth Observation Users Single Sign On service, or EO-SSO.
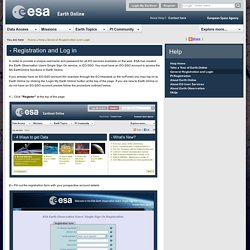
You must have an EO-SSO account to access the My EarthOnline functions in Earth Online. If you already have an EO-SSO account (for example through the EO helpdesk or the eoPortal) you may log on to Earth Online by clicking the 'Login My Earth Online' button at the top of the page. If you are new to Earth Online or do not have an EO-SSO account, please follow the procedure outlined below: Educational Activities « Landsat Science. NASA Wavelength is your pathway into a digital collection of Earth and space science resources for educators of all levels – from elementary to college, to out-of-school programs.
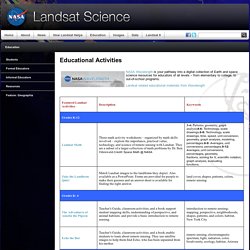
Landsat related educational materials from Wavelength Additional NASA Education Resources. Analysis. Spectral Angle Mapper Classification The Spectral Angle Mapper Classification (SAM) is an automated method for directly comparing image spectra to a known spectra (usually determined in a lab or in the field with a spectrometer) or an endmember.
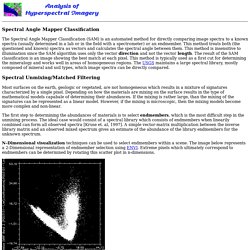
This method treats both (the questioned and known) spectra as vectors and calculates the spectral angle between them. This method is insensitive to illumination since the SAM algorithm uses only the vector direction and not the vector length. The result of the SAM classification is an image showing the best match at each pixel. This method is typically used as a first cut for determining the mineralogy and works well in areas of homogeneous regions. Spectral Unmixing/Matched Filtering Most surfaces on the earth, geologic or vegetated, are not homogeneous which results in a mixture of signatures characterized by a single pixel.
N-Dimensional visualization techniques can be used to select endmembers within a scene. Other Classification Techniques. Copernicus. Remote Sensing Tutorial Table of Contents. Band Combinations. Landsat Thematic Mapper (TM) Band 1 (0.45 - 0.52u m): provides increased penetration of water bodies and also capable of differentiating soil and rock surfaces from vegetation and for detecting cultural features.
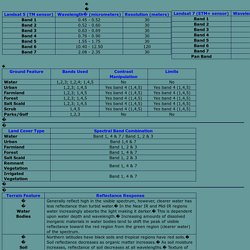
Band 2 (0.52 - 0.60u m): it is sensitive to water turbidity differences; it highlighted the turbid water in the Barkley Lake. Because it covers the green reflectance peak from leaf surfaces, it has separated vegetation (forest, croplands with standing crops) from soil. In this band barren lands urban areas and roads and highways have appeared as brighter (lighter) tone, but forest, vegetation, bare croplands, croplands with standing crops have appeared as dark (black) tone.
Also the Kentucky Lake has appeared as black tone. Band 3 (0.63 - 0.69u m): senses in a strong chlorophyll absorption region and strong reflectance region for most soils. Band 4 (0.76 - 0.90u m): operates in the best spectral region to distinguish vegetation varieties and conditions. Band combinations. Winter Storm Stalls Thanksgiving Travel. As millions of Americans are taking to the highways for the Thanksgiving holiday, a powerful winter storm is plowing across the nation.
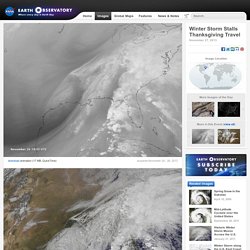
The storm is leaving snow, ice, and rain in its wake, creating hazardous travel conditions. By the time the storm is over, it will have brought wintery weather to 2.5 million square miles of the United States. The storm is big news because it is disrupting travel during one of the busiest travel period of the year, but it's not otherwise all that unusual, says NASA research scientist Chris Kidd.
“Large storms are expected a few times each winter, particularly at this time of the year,” says Kidd. Giovanni - TRMM L-3 V6 and V7 Inter-comparison. LearnEO!: Resources for Earth Observation education. National Geologic Map Database. Background.
EU satellite data to be freely available. Copernicus already gathers and processes data from satellites.

In the future it will expand to include six dedicated satellite missions, called Sentinels, to be launched from 2014 onwards. It is hoped that the freely available data will help further environmental understanding, allowing businesses, researchers, citizens and policy makers to integrate greater environmental knowledge into everything they do. USGS Mineral Resources On-Line Spatial Data. Software. TRMM. Download ERDAS IMAGINE 2013 (includes LPS) ERDAS IMAGINE 2013 (including LPS) is the full released product that includes all three tiers of ERDAS IMAGINE 2013, LPS 2013, and most associated add-ons.
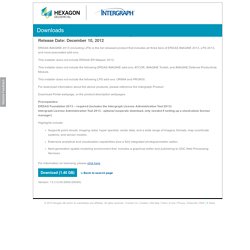
This installer does not include ERDAS ER Mapper 2013. This installer does not include the following ERDAS IMAGINE add-ons: ATCOR, IMAGINE Toolkit, and IMAGINE Defense Productivity Module. This installer does not include the following LPS add-ons: ORIMA and PRO600. For download information about the above products, please reference the Intergraph Product Download Portal webpage, or the product description webpages. Prerequisites: ERDAS Foundation 2013 – required (includes the Intergraph License Administration Tool 2013) Intergraph License Administration Tool 2013 - optional (separate download, only needed if setting up a stand-alone license manager) Highlights include: Supports point clouds, imaging radar, hyper spectral, vector data, and a wide range of imagery, formats, map coordinate systems, and sensor models. Remote Sensing Tutorial Overview. Also of value are these Periodicals devoted largely to remote sensing methods and applications: To expand upon the remarks at the beginning of the Overview, the primary purpose of this Tutorial is to be a learning resource for college students, as well as for individuals now in the work force who require indoctrination in the basics of space-centered remote sensing.
In both instances the objective is to offer a background that will actually be useful in current or eventual job performance to those who may need to provide input information obtainable from remote sensing into day-to-day operations. Resolution in remote sensing terms. It is important to understand how a remote sensing tool operates in order to appreciate its ability to detect features - such as habitats - on the seabed (in intertidal or subtidal areas). There are many excellent texts and websites explaining all the technical aspects of remote sensing; for example Green et al., describe the use of satellite and airborne remote sensors for marine mapping in tropical waters.
The following text is based on information available on the US NASA website with some definitions taken from Wikipedia. Remote sensors measure and record the magnitude and frequency of reflected energy from an object where the ‘energy’ is generally either electromagnetic radiation (light) or acoustic (sound). Early remote sensing devices recorded photographic images on film (taken by cameras) or traces printed onto paper rolls (sonar devices). Both routes created an image in analogue format. Resolution has a popular meaning but is best defined in a technical sense.
Links to websites. An overview of spatial adjustment. Remote Sensing.