
GMap.NET - Great Maps for Windows Forms & Presentation. .NET Diagram by Nevron, UML Diagrams, .NET Diagrammer, Diagramming Control, .NET Diagram, Relational Diagram, HMI, HMI Diagram, ASP.NET Diagram, Business Diagrams, Specialized Diagrams, Org Chart, Flow Chart, Ajax Diagrams, Visio like Diagrams. Charting Components by Steema, Chart for .NET, VCL, ActiveX, Java, PHP and Mobile. Data Visualization Charts.
Search by criteria: Financial TeeChart offers many indicators specifically designed to track financial data.
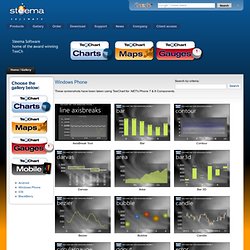
Here is a subset of them. MACD Function Multiple Axes on Chart Volume Chart Candle (OHLC) Chart Renko with Volume Data Candle, Darvas and Volume Chart EquiVolume Point & Figure Zoom, Scroll and Navigate Bars Bars may be vertical, horizontal, floating or composite with other data representation types Bar Chart 2D Bar Chart Horizontal Bar Chart 3D Tower Chart OpenGL Bar Chart Histogram Horizontal Histogram DataGrid Javascript Bar Chart Mobile Bar Chart 3D Bar Style Tower Stacked Horizontal Bar Tower Dark Format Point & Scatter Points are the way to plot x,y or x,y,z data. ..then join the points with lines, smooth, change marker types, size and style according to taste.
Point and Scatter Chart Point and Scatter with Line Bezier Chart Point and Scatter Bubble Chart Arrow Chart Bubble Scatter Point & Line Circular Circular include Polar, Smith and Radar charts Polar Chart Smoothed Polar Chart. TatukGIS - Geographic Information Systems. GIS - MapWindow ActiveX Control. The core MapWindow component is the ActiveX control, "MapWinGIS.ocx".
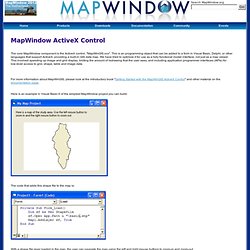
This is an programming object that can be added to a form in Visual Basic, Delphi, or other languages that support ActiveX, providing a built-in GIS data map. We have tried to optimize it for use as a fully functional model interface, not just as a map viewer. This involved speeding up image and grid display, limiting the amount of redrawing that the user sees, and including application programmer interfaces (APIs) for low-level access to grid, shape, table and image data. For more information about MapWinGIS, please look at the introductory book "Getting Started with the MapWinGIS ActiveX Control" and other material on the documentation page. Here is an example in Visual Basic 6 of the simplest MapWindow project you can build: The code that adds this shape file to the map is: With a shape file layer loaded in the map, the user can navigate the map using the left and right mouse buttons to zoom-in and zoom-out.
WPF Data Visualization - Map Control for Providing Rich, Interactive Geospatial Data. Get your 30 Day Free trial of WPF Controls as part of Infragistics Ultimate.
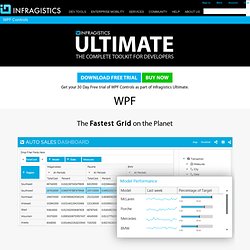
The Fastest Grid on the Planet Speed and Scalability When it comes to your Windows applications, performance matters. If you have massive amounts of data that requires lightning-fast processing, only the industry’s top-performing controls will do. No other Data Grid on the market can even compare to the power and performance level you get with the Infragistics WPF Data Grid. Blazing Fast Charts Over 50 different charts, each one faster than the next. ArcObjects SDK for .NET. SharpMap - Geospatial Application Framework for the CLR - SharpMap v2. Map Suite Desktop Edition - WPF/Winforms GIS Controls for .NET - Screenshots.
Bing Maps Winforms User Control - Home. GMap.NET - Great Maps for Windows Forms & Presentation - Home. Map control for WPF, WPF Map component.