
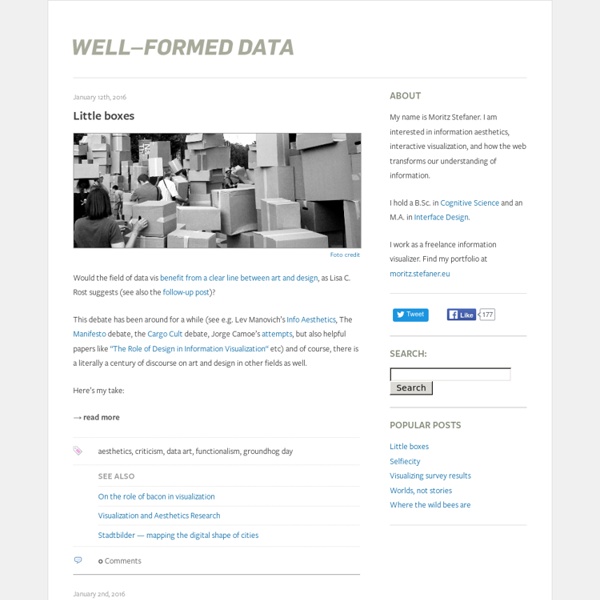
ガスバス Get free Twitter buttons and grow your followers fast! FlowingData | Visualization and Statistics Vis Group | Voyagers and Voyeurs: Supporting Asynchronous Collaborative Information Visualization The sense.us collaborative visualization system. (a) An interactive visualization applet, with a graphical annotation for the currently selected comment. The visualization is a stacked time-series visualization of the U.S. labor force, broken down by gender. Here the percentage of the work force in military jobs is shown. abstract This paper describes mechanisms for asynchronous collaboration in the context of information visualization, recasting visualizations as not just analytic tools, but social spaces. materials and links citation
Создание файла Sitemap для видео - Cправка - Инструменты для веб-мастеров Guidelines for video content in Sitemaps Each Sitemap or mRSS feed file that you provide must be under 50MB in size when uncompressed, and can contain no more than 50,000 video items. If your uncompressed file is larger than 50MB, or you have more than 50,000 videos, you can submit multiple Sitemaps and a Sitemap index file. Video content includes web pages which embed video, URLs to players for video, or the URLs of raw video content hosted on your site. Adding video content to a Sitemap based on the Sitemap protocol The entries in a video Sitemap must include a link to a landing page for a video and some required information. Once you have created your Sitemap, you can submit it to Google using Webmaster Tools. Here is a sample of a Sitemap entry for a page that includes video. Video-specific tag definitions
Datavisualization.ch Small Design Firm NRC: Naturalist Tables, Raleigh, North Carolina, 2012 Small Design Firm developed two completely custom interactive tables for the Nature Research Center at the North Carolina Museum of Natural Sciences. Visitors to the museum are invited to pick up actual specimens from the museum collection and place them on to the table surface. When the table reads the tagged specimen, video projection from above reveals activities and field guide information pertaining to the specimen. There are over a hundred available specimens, ranging from mounted insects and preserved amphibians, to mammal study skins and bird skulls. Housed in the Naturalist Center, these tables use a combination of capacitive touch technology and RFID tracking to create a truly unique, hands on, research experience. Project Details NRC: Storm Central & Real Time Weather Station, Raleigh, North Carolina, 2012 Nearby, a model of a weather station shows how meteorologists collect data in the field. Project Details Project Details
Specify your canonical Carpe diem on any duplicate content worries: we now support a format that allows you to publicly specify your preferred version of a URL. If your site has identical or vastly similar content that's accessible through multiple URLs, this format provides you with more control over the URL returned in search results. It also helps to make sure that properties such as link popularity are consolidated to your preferred version. Let's take our old example of a site selling Swedish fish. However, users (and Googlebot) can access Swedish fish through multiple (not as simple) URLs. Or they have completely identical content, but with different URLs due to things such as a tracking parameters or a session ID: Now, you can simply add this <link> tag to specify your preferred version: inside the <head> section of the duplicate content URLs:
Nicholas Felton | Feltron.com Amnon P5 – Experiments with Processing by Amnon Owed