background preloader

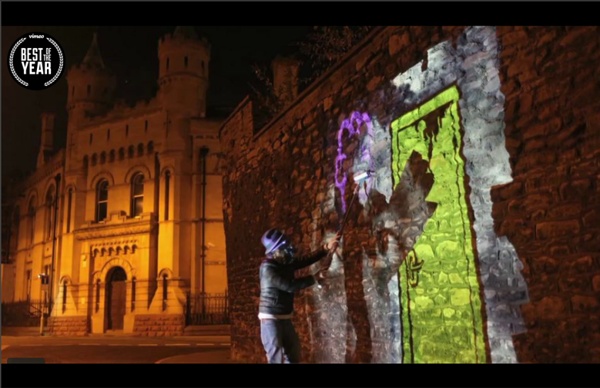
SWEATSHOPPE Video Painting Europe

SWEATSHOPPE Video Painting Europe

http://vimeo.com/39765217

Related:  `test 1020`test 1020`test 1023

Surprising Parallels Found Between Solar Activity And Hurricane Development Cat 5 Hurricane “Dorian” showed a development parallel to a solar storm lasting several days, which reached the earth from 27 August to 4 September 2019. By Snowfan The strength of particle radiation of a solar storm is given as a three-hour value in the Kp index, the daily value is called the A index. The following table shows the development of hurricane DORIAN compared to solar activity in the daily values of the A index. Source: The parallels are astonishing: It would seem DORIAN was “fed” by the strength of the solar storm in its development, especially in its peak around September 1, 2019. It’s well known, of course: correlation isn’t causation. So the question arises: How could solar storms influence earthly hurricanes? A commentator made the following interesting comments on hurricane activity in 2017 (including IRMA), and 2018 in the North Atlantic and a connection of solar activity with regard to changes in the jet stream: Snowfan 2015

Symmetry and Balance Guest Post by Willis Eschenbach The CERES satellite dataset is a never-ending source of amazement and interest. I got to thinking about how much energy is actually stoking the immense climate engine. Of course, virtually all the energy comes from the sun. So let’s start from the start, at the top of the atmosphere. Figure 1. However, we don’t get all of that energy. Figure 2. Once I had the available energy, I subtracted out the seasonal variations. So here is the first look at how much energy is available to drive the great planet-wide heat engine that we call the climate, divided by hemispheres: Figure 3. Bear in mind that the amount of energy that enters the climate system after albedo reflections is a function of highly variable ice, snow, and clouds … and despite that, there is only very little variation over either time or space. Figure 4. Now, I noticed a few curiosities about this graph. Second, the two hemispheres generally move in parallel. Figure 5. Figure 6. Figure 7. w.

Glo-Mo: Designing a High Tech Dance “To me, the lights were artwork of themselves. There were the dancers dancing under art, with art on their bodies, so it just brought the whole picture together,” said Danielle Sampson, a dance teacher at Grand Center Arts Academy. I attend Grand Center Arts Academy, a school for the fine arts that goes from 6th-12th grade. “I think the dance was made for the lights, because if you were watching it without the lights then it looks kind of boring, but the lights totally made it a cool hypnotic effect,” says Brianna Ford, a tenth grader who was in the dance. To start with, I had a meeting with the dance teachers who choreographed the dance to the song I Remember, by deadmau5. After the Pulitzer performance, the group performed two more times. “It was nerve-wracking because we need[ed] to get ready [for the dance], but we also need[ed] to do the lights. We only had three of the dancers working, but it moved fairly quickly. Photo Credit: Juju & Erich Vieth Chase Doctor

outdoor flush mount ceiling light Sunspots, Verse 25 Guest Post by Willis Eschenbach [See update at the end] I started out as a true believer that sunspots (or something that changes in sync with sunspots, like heliomagnetism, cosmic rays, solar wind, etc.) had a strong effect on the weather. When I was a kid I read that the great British astronomer William Hershel had said that British wheat prices were affected by the sunspot cycle. Made sense to me … So when I started looking into the question, I figured it would be a piece of cake to find evidence supporting the connection … but nothing in climate science is simple. Undaunted, I continued to look for correlations, and I’ve done so from time to time ever since. Yesterday, a chance comment about sea surface temperature (SST) gave me a new thought about how to look for the signal. Since the original idea was about sea surface temperature (SST), I thought I’d start with that. It’s available here as a NetCDF document. Figure 1. Next, I thought I’d take a look at a global dataset. Figure 2.

Take the Climate Challenge Last night PBS aired the most impressive presentation yet of “Official” climate doctrine. I don’t say “science” because it mounts a powerful advocacy for a particular viewpoint and entertains no alternative perspectives. The broadcast is extremely well crafted with great imagery, crisp sound bite dialogue and sincere acting. With all the invested effort, talent and expense, it is probably the strongest yet Blue Team argument for climate alarm and against fossil fuel consumption. As such we can expect that large audiences of impressionable people of all ages will be exposed to it. The telecast will be repeatedly aired this month on NOVA on US PBS stations. Update April 20: An independent review of the documentary is added at the end. Decoding the Weather Machine Discover how Earth’s intricate climate system is changing. Program DescriptionDisastrous hurricanes. Outline Of Themes (Excerpts in italics from the transcript with my added images and pushback) Alarming Weather and Wildfires

Optical Illusions - grade 5 I just adore doing optical illusions, and kids really seem to love them too. This is a great one that students can easily experience success with (especially if you use my template!) Let me start by talking about the template. I debated for a while if I would give them one, wondering if I was giving them too much of an advantage or not. First, have students trace the lines on the template. I gave the students the option to add a T to the tender of the circle. Once they are done this part, they can start the fun part - coloring them in! I advised them to color the background first, then do the circles. This project is definitely a 3 period project - we have done two one hour periods, and only two kids are done so far.

Tectosilicates & Other Minerals Quartz Quartz is hexagonal and commonly occurs as crystals ranging in size form microscopic to crystals weighing several tons. Where it crystallizes unhindered by other crystals, such as in cavities in rock or in a liquid containing few other crystals, it shows well-developed hexagonal prisms and sometimes showing apparent hexagonal pyramids or dipyramid. As visible crystals, Quartz is one of the more common rock forming minerals. Several varieties of Quartz can be found, but these are usually only distinguishable in hand specimen. A fibrous variety of Quartz is called Chalcedony. Very fined grained aggregates of cryptocrystalline quartz makes up rock like Flint and Chert. Optical Properties Quartz is uniaxial positive with a low relief and low birefringence, thus exhibited only 1o gray to 1o white interference colors. In Chalcedony, the fibers are usually elongated perpendicular to the c-crystallographic axis and thus are length fast.

Squeezing The Sponge Over in the Tweetosphere, where I’m @WEschenbach, I read that we’re in for rainy times: The atmosphere cools and shrinks when the Sun gets sleepy. Rain is wrung out of it like a sponge. We have been entering a solar grand minimum since 2008. The bottom of it will be around 2035. There are two parts to that claim. First, does the troposphere cool down during times when low sunspots signify low solar activity? Figure 1. Note that there are no negative correlations between tropospheric temperatures in different parts of the world. But not one part of the troposphere is positively correlated with sunspots as the claim would require. Now, the absence of evidence is not evidence of absence. Next, let’s examine the claim that we’ll have lots more rain because it would get “wrung out of” the cooler troposphere. Here’s a way to envision it. So, having considered what I might expect to find, I ran the numbers. Figure 2. (Unfortunately, I can’t find numbers for global TPW. Figure 3. Conclusions? w.

OpenGeo

Related: