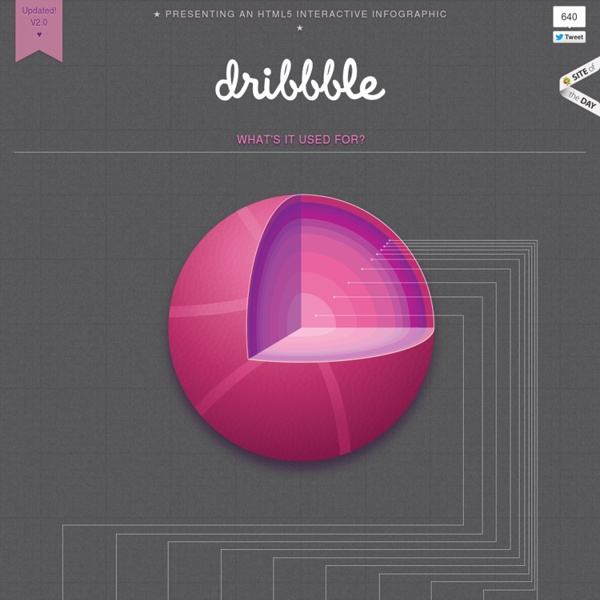


http://lab.4muladesign.com/dribbble/
Related: Infographics15 Useful Infographics For Designers And Developers Writen by Bogdan / Comments Off on 15 Useful Infographics For Designers And Developers Information graphics or infographics are graphic visual representations of information, data or knowledge. These graphics present complex information quickly and clearly,[1] such as in signs, maps, journalism, technical writing, and education. With an information graphic, computer scientists, mathematicians, and statisticians develop and communicate concepts using a single symbol to process information. Design a Vintage Typographic Wedding Invitation Today we’re going to take a step back from the web to embark on a good old fashioned print design project. Wedding invitations have become a major target for home-grown design experiments so we’re going to dive into one and see what we can come up with. We’ll use a major typography focus combined with some simple icons to give the finished product a sophisticated vintage appeal. We’ll also do the whole thing using just two spot colors. Document Setup The first thing that we need to do is set up a document.
The Anatomy Of An Infographic: 5 Steps To Create A Powerful Visual Information is very powerful but for the most bit it is bland and unimaginative. Infographics channel information in a visually pleasing, instantly understandable manner, making it not only powerful, but extremely beautiful. Once used predominantly to make maps more approachable, scientific charts less daunting and as key learning tools for children, inforgraphics have now permeated all aspects of the modern world. Designing Quality Infographics: Tips, Resources and Inspiration Infographics are graphic visual representations of data and information. They come in extremely handy when you need to explain complex information, numbers or data rather quickly and effectively. Infographics are used worldwide from magazines to metro stations.
make your own infographics Infographics (or Information Graphics) are graphic visual representations of data or information, presented in a way to make it easier to consume information. Infographics gained popularity in the mid-2000′s with the advent of sites like Digg and Reddit, and have quickly become one of the most popular methods to display researched data. There are three main types of infographics – where data is presented in a timeline, where statistical data is presented in graphs or with icons, or where data is presented on a map.
15 New Extremely Creative Infographics With the help of evolution and progress, people’s lives become easier day by day. Today everything is simpler than it used to be in the past. Let’s take information for example. Information is displayed everywhere we go and to make it easier to read it, people have created special graphics that help us get is faster. The way information is displayed is very important; because this is how someone would interpret something you wanted to say. Infographics are graphic visual representations of data and information and it is the best way to visualize an idea or a thought.
The Do's And Don'ts Of Infographic Design - Smashing Magazine Advertisement Editor’s Note: You might want to read Nathan Yau’s article The Do’s And Don’ts Of Infographic Design: Revisited1 here on Smashing Magazine which is a response to this article. Since the dawn of the Internet, the demand for good design has continued to skyrocket. From Web 1.0 to Web 2.0 and beyond, designers have remained on their toes as they define the trends and expectations of our online universe. The Internet is a great designer’s playground, and online businesses are growing more and more appreciative of what can be gained from a bit of well-executed eye candy. Over the past two years, this fact has become the backbone of a growing trend in online marketing: the infographic.
4 Simple Tools for Creating an Infographic Resume This post originally appeared on the American Express OPEN Forum, where Mashable regularly contributes articles about leveraging social media and technology in small business. As a freelancer or job seeker, it is important to have a resume that stands out among the rest — one of the more visually pleasing options on the market today is the infographic resume. An infographic resume enables a job seeker to better visualize his or her career history, education and skills. Unfortunately, not everyone is a graphic designer, and whipping up a professional-looking infographic resume can be a difficult task for the technically unskilled job seeker. For those of us not talented in design, it can also be costly to hire an experienced designer to toil over a career-centric infographic.
40 Useful and Creative Infographics Six Revisions Menu Main Categories CSS HTML JavaScript