
VisDock in Raster & Vector Zoom Example. Example CanvasLayer - WebGL. Maps Shortcuts: Large Data Geotemporal Visualizations with WebGL. Wboykinm/ophz. GDAL/OGR user docs. Demo.geo-solutions.it/share/foss4g2011/gs_steroids_sgiannec_foss4g2011.pdf. Animate your maps with GeoServer Animator Tool. In this blog post we’d like to introduce you to a new GeoServer feature, the WMS animator.
The animator follows in the footsteps of the WMS reflector, allowing a client to build an animated map with a relatively compact syntax. An animation is built as a set of frames, and each frame is a separate WMS GetMap call, similar to the others in the set, but with a different value in one of the parameters. The animator allows you to specify the parameter that will vary and its value via the aparam and avalues request parameter. For example, let’s say we have a dataset with time support enabled, in particular a small set of blumarble images for the different months in the year.
A call to get a continuously animated progression would look like: The aparam in this request is the WMS time parameter, while the avalues list a number of possible times, in particular a few months of the year. For example, we could change the bounding box and have the map move: Www.diva-portal.org/smash/get/diva2:640096/FULLTEXT01.pdf. Serving Meteo data with GeoServer, GeoBatch and GeoNetwork: the LaMMA use case.
Python - Convert timeseries stack of GTiff raster to single NetCDF. Moving from gdal-dev mailing list: On Mon, Sep 2, 2013 at 7:09 PM, David Shean wrote: Hi list, I'm trying to package a timeseries of GTiff rasters with identical projection/extent/resolution as a single NetCDF file for distribution.
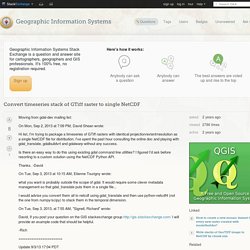
I've spent the past hour consulting the online doc and playing with gdal_translate, gdalbuildvrt and gdalwarp without any success. Is there an easy way to do this using existing gdal command line utilities? I figured I'd ask before resorting to a custom solution using the NetCDF Python API. Thanks. On Tue, Sep 3, 2013 at 10:15 AM, Etienne Tourigny wrote: what you want is probably outside the scope of gdal. I would advise you convert them all to netcdf using gdal_translate and then use python-netcdf4 (not the one from numpy/scipy) to stack them in the temporal dimension.
UsersWikiPostGIS20CentOS6pgdg – PostGIS. This installation method uses YUM packages maintained by Devrim GUNDUZ of the PostgreSQL Global Development Group (PGDG).
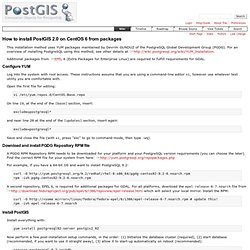
For an overview of installing PostgreSQL using this method, see other details at Additional packages from EPEL 6 (Extra Packages for Enterprise Linux) are required to fulfill requirements for GDAL. Configure YUM ¶ Log into the system with root access.
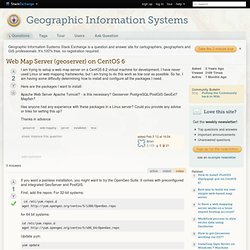
Davidl340/geonetcdf. Web mapping - Web Map Server (geoserver) on CentOS 6. Current community your communities Sign up or log in to customize your list. more stack exchange communities Stack Exchange sign up log in tour help Geographic Information Systems Ask Question Take the 2-minute tour × Geographic Information Systems Stack Exchange is a question and answer site for cartographers, geographers and GIS professionals.
Gdalsetnull.py - maphew - A hewer of maps' small collection of tools I've built for myself, which may one day be useful for others. Tile_overlay.js - googlecrisismap - Google Crisis Map. UserDocs/RasterProcTutorial – GDAL. This is a working copy of a tutorial to be presented at FOSS4G 2007 (L-01) that will hopefully also be useful as a web based tutorial in the future.
Objectives[edit] ¶ A practical tutorial on processing and preparing raster data for visualization or futher analysis. Exercises will include: Exploring your image data Format translation Optimizing data for MapServer/MapGuide? /etc Rescaling Mosaicing Reprojection Using virtual files. UserDocs/RasterProcTutorial – GDAL. GDAL raster data tips and tricks. Animated Maps in Google Earth. Google Earth can display geographic data with a time component, and thus show animated maps.
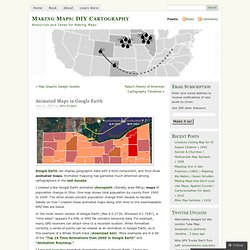
Animated mapping has garnered much attention among cartographers in the last decade. Map Types - Google Maps JavaScript API v3. Map Types This document discusses the types of maps you can display using the Google Maps Javascript API.
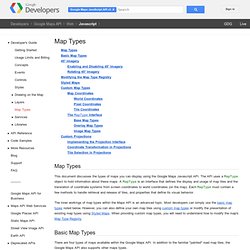
The API uses a MapType object to hold information about these maps. A MapType is an interface that defines the display and usage of map tiles and the translation of coordinate systems from screen coordinates to world coordinates (on the map). Blog.broc.seib.net: Tile overlays with Google Maps API v3 and GeoServer. I was introduced to the Google Maps v3 API last May at Google I/O.
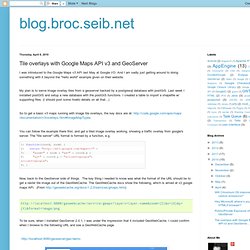
And I am sadly just getting around to doing something with it beyond the "hello world" example given on their website. My plan is to serve image overlay tiles from a geoserver backed by a postgresql database with postGIS. Last week I installed postGIS and setup a new database with the postGIS functions.
Displaying Animated Tile Layers on Bing Maps v7. Animated Radar Weather Map This map demonstrates how to use a custom module to add an animated tile layer to the Bing Maps v7 AJAX control.
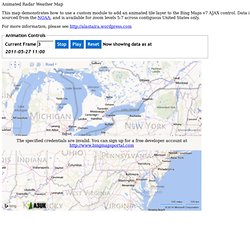
Data is sourced from the NOAA, and is available for zoom levels 5-7 across contiguous United States only. Animated GIF Tile Layers on Bing Maps v7. The 4th Dimension – Creating Dynamic Animated Tile Layers in Bing Maps (AJAX v7) – Part 2 (recovered) In my last post, I attempted to create an animated weather map in Bing Maps by using a custom tilelayer that pointed to a set of dynamically-generated animated GIF image tiles.
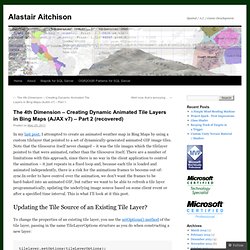
Note that the tilesource itself never changed – it was the tile images which the tilelayer pointed to that were animated, rather than the tilesource itself. There are a number of limitations with this approach, since there is no way in the client application to control the animation – it just repeats in a fixed loop and, because each tile is loaded and animated independently, there is a risk for the animations frames to become out-of-sync.In order to have control over the animation, we don’t want the frames to be hard-baked into an animated GIF, but rather we want to be able to refresh a tile layer programmatically, updating the underlying image source based on some client event or after a specified time interval. This is what I’ll look at it this post. Updating the Tile Source of an Existing Tile Layer? GDAL API Tutorial. Before opening a GDAL supported raster datastore it is necessary to register drivers. There is a driver for each supported format. Normally this is accomplished with the GDALAllRegister() function which attempts to register all known drivers, including those auto-loaded from .so files using GDALDriverManager::AutoLoadDrivers().
If for some applications it is necessary to limit the set of drivers it may be helpful to review the code from gdalallregister.cpp. Python automatically calls GDALAllRegister() when the gdal module is imported. Once the drivers are registered, the application should call the free standing GDALOpen() function to open a dataset, passing the name of the dataset and the access desired (GA_ReadOnly or GA_Update). Extracting Raster Information with GDAL and Python. Introduction The Geospatial Data Abstraction Library (GDAL) is a library for manipulating raster data. It is maintained by the Open-source Geospatial Foundation (OGF) and normally comes bundled with its sister library OGR. OGR allows vector data to be manipulated. If you already use geo-spatial software you probably have GDAL installed already.
Creating super-overlays with gdal2tiles - Keyhole Markup Language. Mano Marks, Google Geo APIs Team September 2009 This tutorial walks you through the basics of creating a super-overlay, a set of ground overlays that use region-based NetworkLinks, using the open source Geospatial Data Abstraction Library utilities. Geobrowsers like Google Earth and Google Maps provide you with satellite imagery and map tiles. However, sometimes you may want to use your own. Imagery, or raster data comes in many forms and has many uses. Placing your own satellite or aerial imagery into a geobrowserPlacing historical maps on top of existing imagery, such as the Rumsey Maps layer in Google EarthImporting GIS data in raster formPlacing LIDAR or infrared imagery in the geobrowser One of the problems with high-resolution raster data, though, is that it takes a lot of memory to display it. Tiling breaks your image file into many different images that load when they come into view.
There are six steps to using GDAL at the command line. Step 1: Download and install GDAL Conclusion. MapTiler, GDAL2Tiles, and Raster Resampling. So I’ve been using MapTiler to create some quick raster tilesets from a set of GeoTIFF images. MapTiler is a Windows application that will reproject and cut any GDAL-supported datasource into a set of 256px x 256px image tiles, suitable for use as a custom tile layer in Google Maps or Bing Maps et al. MapTiler is essentially just a GUI wrapper around the GDAL2Tiles.py python script, which is distributed as part of GDAL. Like all GUI wrappers, it provides a convenient front-end interface, and doesn’t require the end user to have any knowledge of command-line processing or build tools. Generating map tiles with GDAL2Tiles. GDAL2Tiles is a command line tool that allows easy publishing of raster maps on the Internet.
The raster image is converted into a directory structure of small tiles which you can copy to your webserver. GDAL2Tiles is included in GDAL/OGR 1.5.0 release. GDAL2Tiles is compatible with the Tile Map Service (TMS) Specification.
Leaflet.js. GeoCommons.