

The most liberal and conservative big cities in America, in one chart Even the most conservative cities in America are barely right of center, as this great chart from the Economist, based on research from Chris Tausanovitch at UCLA and Christopher Warshaw at MIT, shows: It's no surprise that most big cities are left of center, as the Pew Research Center points out. What's interesting is how liberal even the median big city is. Cincinnati, for example, hangs around the center of big cities' political spectrum, but the Economist's chart shows it's still fairly liberal. For another look at the liberal and conservative towns and cities each state, check out this map from Business Insider: WATCH: 'The 220-year history of the anti-vaccine movement
Red Temática - Welcom The Spanish thematic network of Linked Data was created in January, 2011 with the aim of facilitating the exchange and transfer of knowledge in the area of Linked Data between Spanish research groups associated to universities, technology centers, public administrations and companies. Besides, we aim at increasing this knowledge transfer with Spanish researchers that are currently working abroad in related areas. The thematic network, led by Oscar Corcho of the Ontology Engineering Group, was funded during 2011 and 2012 by the Ministerio de Ciencia e Innovación, initially, and then by the Secretaría de Estado de Investigación, Desarrollo e Innovación, the Ministerio de Economía y Competitividad. Despite having no funding after 2013, their activities will be continued with the collaboration of the active members
What Is Digital Humanities and What’s it Doing in the Library? tl;dr – Libraries and digital humanities have the same goals. Stop asking if the library has a role, or what it is, and start getting involved in digital projects that are already happening. Advocate for new expanded roles and responsibilities to be able to do this.
stumbleupon Climate scientists tend not to report climate results in whole temperatures. Instead, they talk about how the annual temperature departs from an average, or baseline. They call these departures "anomalies." They do this because temperature anomalies are more consistent in an area than absolute temperatures are. Introduces Novel Molecule Challenge WALTHAM, MA - January 25, 2011 - InnoCentive, the global leader in Challenge Driven Innovation, today announced the launch of a new Challenge offering, the Novel Molecule Challenge (NMC). Housed in InnoCentive’s new Novel Molecule Pavilion, this groundbreaking offering brings open innovation to owners of molecule compound libraries – including academic institutions and custom molecule synthesis labs – by providing an easy and secure way for them to interact with corporations seeking new molecules for product research and development. The Novel Molecule Challenge is a natural evolution of previous Challenges posted on InnoCentive’s web site by Seeker organizations looking for novel compounds. In the past, Solvers viewed one molecular Challenge at a time, checked the request against their compound collection, and if a match was found, submitted their compound as a solution to the Challenge. The new NMC represents a much simpler and more efficient process whereby: About InnoCentive, Inc.
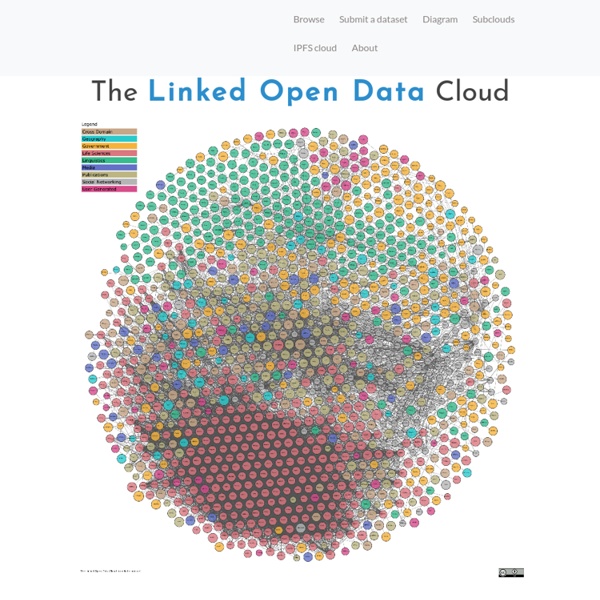
Linked Data - Design Issues Up to Design Issues The Semantic Web isn't just about putting data on the web. It is about making links, so that a person or machine can explore the web of data. With linked data, when you have some of it, you can find other, related, data. Like the web of hypertext, the web of data is constructed with documents on the web. However, unlike the web of hypertext, where links are relationships anchors in hypertext documents written in HTML, for data they links between arbitrary things described by RDF,. Shifting tides: Global economic scenarios for 2015–25 At the National People’s Congress in Beijing in March 2015, China’s Premier Li Keqiang announced a growth target of 7 percent, acknowledging that “deep-seated problems in the country’s economy are becoming more obvious.” Three months later and thousands of miles away in Washington, the World Bank lowered its growth forecasts across the board and asked the US Federal Reserve Bank to delay any contemplated rate hikes. The World Bank’s chief economist said that it had “just switched on the seat belt sign. We are advising nations, especially emerging economies, to fasten their seat belts.” So it’s going to be a bumpy ride? How bumpy?
Fusion Tables Bust your data out of its silo! Get more from data with Fusion Tables. Fusion Tables is an experimental data visualization web application to gather, visualize, and share data tables. Visualize bigger table data online How to Approach Open Innovation: The 15inno Open Innovation Roadmap As we can define open innovation in many ways, there are also many different approaches to open innovation. How do you get started? OVO Innovation has developed a topology that builds on two defining attributes.