
iGirouette. BuzziSpace. BuzziLoose. BuzziSpace. Fabrique - Hacktion. N.2 HHHHEnsci les ateliers Les salle de cours du deuxième étage sont chargées en imposantes structures et plateaux, trop nombreux, inutilisés.

Les pièces d'assemblage arrangent l'atelier en superposant le mobilier. La construction d'étagères est assurée par une jonction solide, une attache en deux parties, à imbriquer Telechargement et Fabrication ← Materiel requis imprimante 3D Telecharger 1 fichier : HHH.iges Fabrication 1. Downloading and making ← Require Material and tools 3D pinter (ABS) Download: 1 file : HHH.iges Making 1. Leap Motion. Data mapping: gadget or business tool?
Points of the same colour and close to each other represent individuals with similarities (e.g. workplace, business) and/or sharing a set of common contacts.
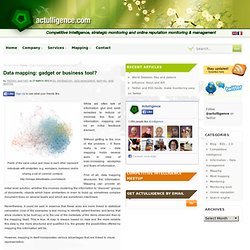
While we often talk of information glut and seek remedies to reduce or minimise this flow of information, mapping can be an initial feedback element. Without getting to the crux of the problem – if there really is one – data mapping holds several aces in view of ever-increasing stockpiles and flows of information. First of all, data mapping structures the information. Mapping can provide an initial level solution, whether this involves clustering the information to “discover” groups of documents, objects which have similarities or even to build up sometimes complex document trees on several levels and which are sometimes interlinked.
However, mapping in itself incorporates various advantages that are linked to visual representation. Consequently, mapping is a real boon for those who may manipulate the data, the information. The book : Time Maps: Morphing a Country According to its Travel Time. In the current age, we tend to think in time rather than absolute distance when estimating our itineraries.
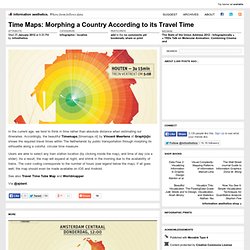
Accordingly, the beautiful Timemaps [timemaps.nl] by Vincent Meertens of Graph[s]ic shows the required travel times within The Netherlands by public transportation through morphing its silhouette along a colorful, circular time measure. Users are able to select any train station location (by clicking inside the map), and time of day (via a slider).
As a result, the map will expand at night, and shrink in the morning due to the availability of trains. The color coding corresponds to the number of hours (see legend below the map). If all goes well, the map should even be made available on iOS and Android. See also Travel Time Tube Map and Worldmapper. Via @ajdant. Le télétravail va tuer la ville – une réflexion de Benoit Sallé. Le 27 octobre 2011 se tenait à la Cantine Numérique Rennaise une conférence, «Télétravail : La percée d’Avranches ».
La présentation de Xavier de MAZENOD, véritable pionnier du domaine, exposait un retour sur expérience sur cette nouvelle pratique. Je ne m’étendrai pas sur la dimension technique du télétravail dans cet article, mais plutôt sur les conséquences qu’il peut avoir sur l’urbanisme et l’architecture. Où, quand et comme je veux. Le télétravail, c’est avant tout fuir les soucis du quotidien, quitter la routine métro (ou auto)-boulot-dodo pour adopter une nouvelle manière d’effectuer sa tâche.
Avec l’émergence des nouvelles technologies, notre bureau se résume bien souvent à un simple ordinateur, la sacro-saint laptop qui nous suit partout, sous réserve d’avoir une bonne connexion au web (et un emploi adapté également). En choisissant de quitter le rythme du travail actuel, le télétravailleur améliore sa qualité de vie. . « Fuck context ! « Suit up », la ville uniforme.