
Wiki - Resources. MangoMap is the easiest way to create engaging web maps from your GIS data. Story Collections. What is a Story Map? Esri Storymaps for Education II. Story Maps. Web Maps, Web Apps, Storymaps. ColorBrewer: Color Advice for Maps. Cynthia Brewer's e-Portfolio. Symbol Store. A clean point of interest icon set from MapBox. Slippy Map. Slippy map Slippy Map is, in general, a term referring to modern web maps which let you zoom and pan around (the map slips around when you drag the mouse).
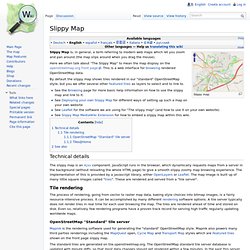
Here we often talk about "The Slippy Map" to mean the map display on the openstreetmap.org front page. This is a web interface for browsing rendered OpenStreetMap data. By default the slippy map shows tiles rendered in our "standard" OpenStreetMap style, but you we offer several other featured tiles as layers to select and to link to. See the Browsing page for more basic help information on how to use the slippy map and link to it. Technical details Tile rendering. Visualizing Friendships. Human Development Index (HDI) The HDI was created to emphasize that people and their capabilities should be the ultimate criteria for assessing the development of a country, not economic growth alone.

The HDI can also be used to question national policy choices, asking how two countries with the same level of GNI per capita can end up with different human development outcomes. These contrasts can stimulate debate about government policy priorities. Project EPIC » Tweak the Tweet. Tweak the Tweet Tweak the Tweet is a hashtag-based syntax to help direct Twitter communications for more efficient data extraction for those communicating about disaster events.
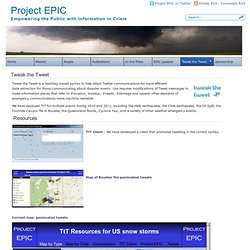
Use requires modifications of Tweet messages to make information pieces that refer to #location, #status, #needs, #damage and several other elements of emergency communications more machine readable. Ushahidi. U.S. Flooding Map & Satellite Images. Current US Weather. Severe Weather Disaster Map & Satellite Images. Dynamic Maps, GIS Data, and Analysis Tools Home Page. Welcome to the Webpage of Professor Daniel B. Carr. Geographic Information Systems & Science - The National Cancer Institute. Penn State University. Lesson 5: Interpolation - From Simple to Advanced. Printer-friendly version Introduction In this lesson, we will examine one of the most important methods in all of spatial analysis.
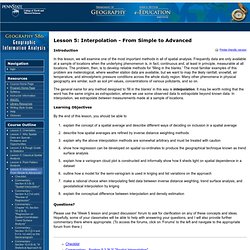
Frequently data are only available at a sample of locations when the underlying phenomenon is, in fact, continuous and, at least in principle, measurable at all locations. The problem, then, is to develop reliable methods for 'filling in the blanks.' The most familiar examples of this problem are meterological, where weather station data are available, but we want to map the likely rainfall, snowfall, air temperature, and atmostpheric pressure conditions across the whole study region. The general name for any method designed to 'fill in the blanks' in this way is interpolation. Learning Objectives By the end of this lesson, you should be able to Questions? Please use the 'Week 5 lesson and project discussion' forum to ask for clarification on any of these concepts and ideas. ArcGIS Help 10.2 - An overview of the Overlay toolset. One of the most basic questions asked of a GIS is "What's on top of what?
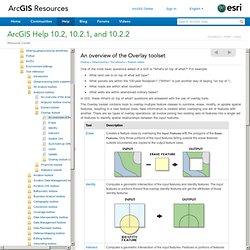
" For example: Geographic Information Systems. Geospatial Metadata — Federal Geographic Data Committee. Natural Earth. GIST_Body_of_Knowledge.pdf.
Classics - Walter Christaller: Hierarchical Patterns of Urbanization. Red, Blue and Purple: mapping 2012 US Presidential Election. Very time an election occurs, maps become a key component in telling the story, but what type of map best tells the story of the winners and losers?
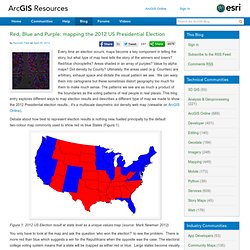
Red/blue choropleths? Areas shaded in an array of purples? Value by alpha maps? Dot density by County? Spatial is Special, Spatial IT is Not. James Fee made an eloquent case for why he made the leap to WeoGeo.
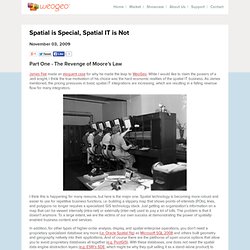
While I would like to claim the powers of a Jedi knight, I think the true motivation of his choice was the hard economic realities of the spatial IT business. As James mentioned, the pricing pressures in basic spatial IT integrations are increasing, which are resulting in a falling revenue flow for many integrators. I think this is happening for many reasons, but here is the major one. Spatial Isn't Special. I was reading Paul’s blog post last week wondering if he had been putting the Jedi Mind Trick on me the last couple years.

I’d like to think that my mind is stronger than that and began to reflect on why I was drawn to WeoGeo after working as a consultant all these years. In the first 10+ years of being a GIS consultant, things were really steady. Our clients didn’t change much (mostly DoD), our billing rates increased over the years as these clients saw value in our implementing professional GIS systems and we never felt like we had too much or too little work. Pure bliss… Coordinates : A resource on positioning, navigation and beyond » Blog Archive » Is spatial special? It is sometimes suggested that spatial data is just another form of data that can now be maintained in a data base and that in reality there is nothing “special about spatial”.
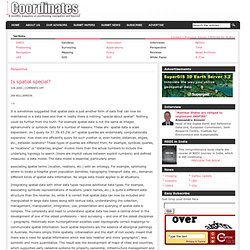
Nothing could be further from the truth. For example spatial data is not the same as integer, alphanumeric or symbolic data for a number of reasons. These are: spatial data is scale dependent: do I query for 37.3N 45.2W..or? Spatial queries are endemically computationally expensive: how does one efficiently query for such position or, even harder, distances, angles, etc., between locations? These types of queries are different from, for example, symbolic queries, as “locations” or “distances, angles” involve more than the actual numbers to include the underlying topology to search (there are implicit values between explicit numbers) and defined measures: a data model. Associating spatial terms (location, relations, etc.) with an ontology. Create beautiful dynamic data driven maps.
The Nature of Geographic Information. An Open Geospatial Textbook David DiBiase with contributions by James L.
Sloan II, Ryan Baxter, Wesley Stroh, Beth Fletcher King, and many students The Pennsylvania State University The purpose of this text is to promote understanding of the Geographic Information Science and Technology enterprise (GIS&T, also known as "geospatial"). Since I began writing in 1997, it has been a vehicle for me to understand the field better and to help my students do the same. GIS. GIS Books & Tutorials - Buy Books Online. Announcements On April 12, 2014, Esri Press received the AAG Publication Award for outstanding contributions to geography. The free Esri Bookstore App offers a new, interactive reading experience with Esri publications. Esri Press Catalog Instructor Resources/Desk Copy Requests Instructors may request desk copies of Esri Press books, and supplementary resources where available, for use in higher education curriculum.