
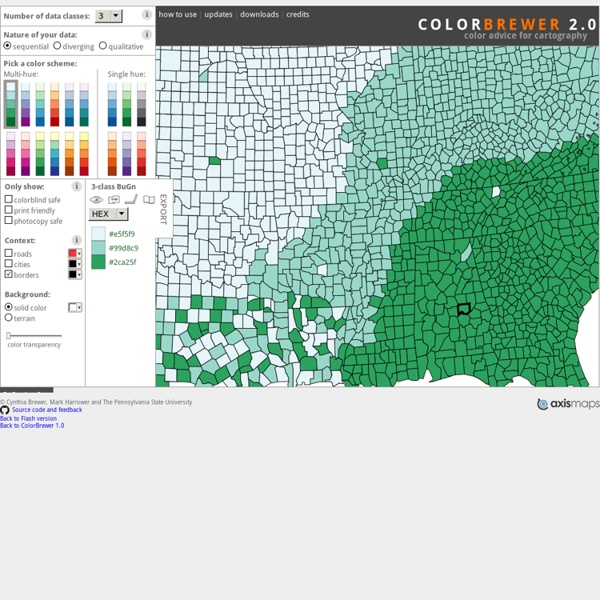
http://colorbrewer2.org/#type=sequential&scheme=BuGn&n=3
Related: data visualisation • CARTOGRAPHY • COULEUR • geo-stuff • Online ToolsSVG Crowbar A Chrome-specific bookmarklet that extracts SVG nodes and accompanying styles from an HTML document and downloads them as an SVG file—A file which you could open and edit in Adobe Illustrator, for instance. Because SVGs are resolution independent, it’s great for when you want to use web technologies to create documents that are meant to be printed (like, maybe on newsprint). It was created with d3.js in mind, but it should work fine no matter how you choose to generate your SVG. The Bookmarklet 40 maps that explain the internet The internet increasingly pervades our lives, delivering information to us no matter where we are. It takes a complex system of cables, servers, towers, and other infrastructure, developed over decades, to allow us to stay in touch with our friends and family so effortlessly. Here are 40 maps that will help you better understand the internet — where it came from, how it works, and how it's used by people around the world. How the internet was created
The Paciello Group – Your Accessibility Partner (WCAG 2.0/508 audits, VPAT, usability and accessible user experience) Features WCAG 2.1 compliance indicatorsSeveral ways to set colours: raw text entry (accepts any valid CSS colour format), RGB sliders, colour picker (Windows and macOS only)Support for alpha transparency on foreground coloursColour blindness simulator Support and development The digital journalist’s toolbox: mapping Engaging and interactive journalism is still possible even without an extensive knowledge of coding. But how? We’ve taken the guesswork out, scouring the internet to find the most accessible tools to create multimedia content. Below, you’ll find a collection of completely free applications that will do all the work for you — no coding required: Google My Maps: This tool is probably the most familiar, simply because it mimics maps seen on a phone’s GPS.
The Likert Question Question » Data Revelations Overview I’ve been looking at various examples over at Stephen Few’s Perpetual Edge web site and one example (this one) really resonates with me as it deals with how to visualize Likert Scale questions. For the past five years I’ve used Tableau to analyze literally thousands of survey questions, but I’ve never really been happy with how I presented Likert Scale questions results. That said, a new version of Tableau has brought new capabilities… But first, just what is a Likert Scale question?
Choosing the best way to indicate map scale By Aileen Buckley, Mapping Center Lead In a previous blog entry, I asked, “Do all maps need a scale bar and north arrow?” I answered, “No” and talked a little about direction indicators like north arrows, but I didn’t really go into any detail about scale bars. Here is a bit more on map scale indicators, like scale bars. Almost all maps are drawn to a scale, so it should be possible for these maps to indicate what the scale of the map is.
Color Contrast Checker You are here: Home > Resources > Contrast Checker <p><strong>This tool requires Javascript.</strong></p> Normal Text Esri Launches National Green Infrastructure Initiative for Planning Esri, the world leader in geographic information system (GIS) technology, has launched a suite of public mapping tools and data to help communities protect the places and natural resources that help people, wildlife, and the economy thrive. Leading the Green Infrastructure for the U.S. initiative, Esri has partnered with National Geographic Society to transform how U.S. communities plan development. By equipping local, regional, and urban municipalities with data and GIS tools, Esri president Jack Dangermond envisions communities working together to build a green infrastructure—a strategically managed network of open spaces, watersheds, wildlife habitats, parks and other areas that deliver vital services and enrich quality of life. With Esri’s green infrastructure planning tools, communities can identify, protect, and connect local places of natural and cultural significance before development occurs. For more information, visit esri.com/greeninfrastructure.