
The Best Tools for Visualization. Visualization is a technique to graphically represent sets of data.
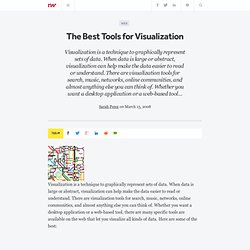
When data is large or abstract, visualization can help make the data easier to read or understand. There are visualization tools for search, music, networks, online communities, and almost anything else you can think of. Whether you want a desktop application or a web-based tool, there are many specific tools are available on the web that let you visualize all kinds of data. Here are some of the best: Visualize Social Networks Last.Forward: Thanks to Last.fm's new widget gallery, you can now explore a wide selection of extras to extend your Last.fm experience. Last Forward Friends Sociomap: Friends Sociomap is another Last.fm tools that generates a map of the music compatibility between you and your Last.fm friends.
Fidg't: Fidg't is a desktop application that gives you a way to view your networks tagging habits. Fidg't The Digg Tools: One more: Digg Radar. YouTube: Visualize Music Musicovery Last.fm music visual tools: Amazon. Pinterest / Home. DESERTEC Knowledge Platform. Personal knowledge base. A personal knowledge base (PKB) is an electronic tool used to express, capture, and later retrieve the personal knowledge of an individual.

It differs from a traditional database in that it contains subjective material particular to the owner, that others may not agree with nor care about. Importantly, a PKB consists primarily of knowledge, rather than information; in other words, it is not a collection of documents or other sources an individual has encountered, but rather an expression of the distilled knowledge the owner has extracted from those sources. Definition[edit] The term personal knowledge base itself was coined in 2011 by Stephen Davies of the University of Mary Washington[1] and has a tripartite definition: personal: a PKB is intended for private use, and its contents are custom-tailored to the individual. Contrast with other classes of systems[edit] The following classes of systems cannot be classified as PKBs: Concept map. An Electricity Concept Map, an example of a concept map A concept map or conceptual diagram is a diagram that depicts suggested relationships between concepts.[1] It is a graphical tool that designers, engineers, technical writers, and others use to organize and structure knowledge.

A concept map typically represents ideas and information as boxes or circles, which it connects with labeled arrows in a downward-branching hierarchical structure. The relationship between concepts can be articulated in linking phrases such as causes, requires, or contributes to.[2] Overview[edit] Automate your Dropbox. Voice2Note - Home Register. Attaching_files. Translations of this page: In addition to item metadata, notes, and tags, Zotero can also be used for managing files.
This page describes the different ways you can add files to your Zotero library, and how added files are stored and synced. File Copies and Links Files can be added to your Zotero library as either copies or links. With copies, a copy of the original file is stored in the Zotero data directory. Adding Files Files can be added either as standalone items, or as child items to other items. Adding Files via the Browser Zotero can automatically save associated web page snapshots and PDFs when you use site translators (whether associated snapshots and PDFs are saved can be changed in the Zotero preferences). With Zotero for Firefox, you can right-click a link to a file in the browser (e.g. to a PDF) and select “Zotero” > “Save Link as Zotero Item”. Adding Files via the Zotero pane Drag and Drop New Item Button File copies and file links can be created by clicking the “New Item” ( Appropedia. WikiMindMap.