
Should I buy bitcoin? Consult the Quartz flowchart. Chart: Are We Living Under Fascism? - by Scott Bateman. The UK's current Brexit options in one... - Information Is Beautiful. Chart: Are We Living Under Fascism? - by Scott Bateman. Tooth & Law – What’s halal? What’s kosher? — Information is Beautiful. Science Infographics Breakdown STEM Subjects as Visual Maps. Click to enlarge It's often easy to get stuck into a narrow view of what a particular field of study entails, but as Dominic Walliman reveals in his impressive science infographics, there's much more than meets the eye when thinking of particular STEM subjects.
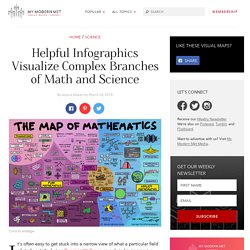
Walliman demonstrates the diversity and complexity of biology, chemistry, computer science, physics, and mathematics in visual maps that explore the breadth of each field. Walliman, who also created animated videos exploring his science infographics, manages to pack all the shades of each complex field on one page. For instance, the Map of Mathematics travels from the origins and foundations of the field to the differences between pure mathematics and applied mathematics. Likewise, chemistry is divided between rules and different sub-topics like biochemistry and inorganic chemistry, with fun illustrations to clearly show what falls underneath each area. Dominic Walliman: YouTube | Flickr h/t: [Open Culture] Related Articles: Why Haven’t You Deleted Your Facebook Yet? - by Scott Bateman. Biggest Fake News Stories of 2017. Super Materials of Tomorrow [INFOGRAPHIC] Islamic Sects, Schools, Branches & Movements. Sunni?
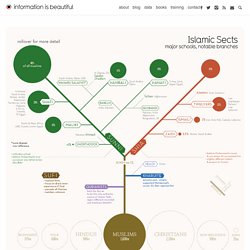
Shia? Tablet Magazine’s 100 Most Jewish Foods List. InfluVennZa – Which Flu Virus? — Information is Beautiful — Infographics. So You Want to Live Forever? [INFOGRAPHIC] Super Materials of Tomorrow [INFOGRAPHIC] Which Fish are the Best, Safest & Healthy to Eat? The Evolution of Spacesuits. How CRISPR Works: The Future of Genetic Engineering and Designer Humans. Infographic. Living Off The Land: A Guide To Settling Mars [Infographic] Reprogramming the Human Mind: Here's How We'll Make Humanity 2.0 [INFOGRAPHIC] Vaccine Myths. Plastic Nanoparticles May Be More Common Than We Think. Global Warming Scenarios. Comparing the Best AI Assistants on the Market. Are We Making Forest Fires Stronger?
Could climate change transform Earth into Venus? [Infographic] Predictive AI: Seeing Through the Chaos. Can We Come Back from Climate Change's Brink? Autonomous Public Transport: The Future of the Urban Commute [INFOGRAPHIC] The Definitive Sandwich Family Tree – The Nib – Medium. Assistive Technology Infographic. The High Price of the Opioid Crisis. Global Warming Scenarios. Wearable Technology. This Map Shows the Hourly Wage You Need to Afford an Apartment in Your State. A new report shows that skyrocketing rent prices have put basic living arrangements out of reach in nearly every state for most low-income workers.

In order to afford a modest two-bedroom apartment in the U.S., workers on average need to earn at least $20.30 an hour, according to 2016 data from the National Low-Income Housing Coalition (NLIHC). That’s roughly $13 more per hour than the federal minimum wage, and roughly $5 per hour more than the average national $15.42 hourly wage earned by renters last year. Even a one-bedroom apartment is out of reach for minimum wage earners today at Fair Market Rent (FMR) levels. FMR is the metric that the Department of Housing and Urban Development uses to determine standard payments for housing choice vouchers, rent ceilings for the HOME rental assistance program, and rents at Section 8 housing developments when contracts are up for renewal.
Fair market rent varies by state. Census 2016: This is Australia as 100 people. Potential For Cannabis. Which Flu Virus? Islamic Sects, Schools, Branches & Movements — Information is Beautiful. How Many Gigatons of CO2? Vaccine Myths. Top 500 Passwords Visualized — Information is Beautiful. This Flow Chart That Destroys Religion’s Case Against Gay Marriage Is So Easy, Any Zealot Can Use It / Queerty.
Plenty of religious folk understand the Bible as what it really is — an allegorical product of a different era used to contextualize this wacky world of ours and implement some reason into the chaos.
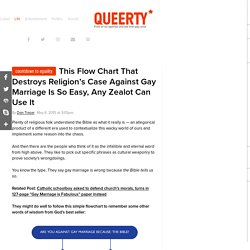
And then there are the people who think of it as the infallible and eternal word from high above. They like to pick out specific phrases as cultural weaponry to prove society’s wrongdoings. You know the type. They say gay marriage is wrong because the Bible tells us so. Related Post: Catholic schoolboy asked to defend church’s morals, turns in 127-page “Gay Marriage is Fabulous” paper instead They might do well to follow this simple flowchart to remember some other words of wisdom from God’s best seller: Related: “Is That Guy Gay?” Get Queerty Daily. This Graphic Puts Global Warming in Full Perspective. To say the world is having a streak like no other is an understatement.
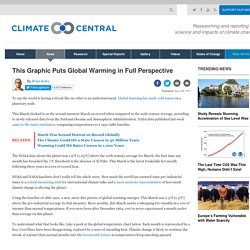
Global warming has made cold scarce on a planetary scale. This March clocked in as the second warmest March on record when compared to the 20th century average, according to newly released data from the National Oceanic and Atmospheric Administration. NASA data published last week came to the same conclusion, comparing temperatures to a 1951-1980 baseline. The NOAA data shows the planet was 1.9°F (1.05°C) above the 20th century average for March, the first time any month has breached the 1°C threshold in the absence of El Niño.
This March is the latest freakishly hot month following three years in a row of record heat. NOAA and NASA baselines don’t really tell the whole story. A new infographic shows that six key factors are driving the change we’re seeing right right now: extreme longevity, the rise of smart machines and systems, our computational world, new media ecology, superstructures organizations and the globally connected world.
With these massive issues in play, what will the working landscape look like in five years? What skills will employees need to succeed? I’ll tell you one thing: they look nothing like the skills desired of workers in the industrial revolution, or even in the dot-com era. In 2020, the ability to come up with solutions, ideas and responses will be highly sought after and will propel you to the front of the business line. Reprogramming the Human Mind: Here's How We'll Make Humanity 2.0 [INFOGRAPHIC] Exponential Technologies Impact What Needs to be Learned In a 2013 white paper titled Dancing with Robots: Human Skills for Computerized Work, Richard Murnane and Frank Levy argue that in the computer age, the skills which are valuable in the new labor market are significantly different than what they were several decades ago.
Computers are much better than humans at tasks that can be organized into a set of rules-based routines. If a task can be reduced to a series of “if-then-do” statements, then computers or robots are the right ones for the job. However, there are many things that computers are not very good at and should be left to humans, at least for now. What is the World’s Biggest Cash Crop? — Information is Beautiful. Yep Cannabis makes serious dough.
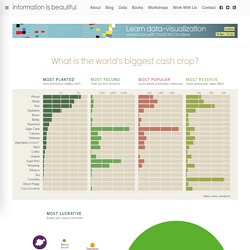
Curious why so many US states – Washington, Oregon, Alaska, Colorado – have decriminalised or even legalized the drug? Because state legislators are getting high on another kind of green. Islamic Sects, Schools, Branches & Movements — Information is Beautiful. Xkcd. Rhetological Fallacies — Information is Beautiful. The Evolution of Brain-Computer Interfaces [INFOGRAPHIC] Support for ISIS in the Muslim World - Perceptions vs Reality. According to a Brookings report from last January: 40% of Americans believe most Muslims oppose ISIS.14% think most Muslims support ISIS.And 44% (the plurality) of Americans believe Muslim views are evenly balanced on the issue.
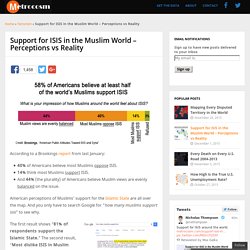
American perceptions of Muslims’ support for the Islamic State are all over the map. And you only have to search Google for “how many muslims support isis” to see why. The first result shows “81% of respondents support the Islamic State.” The second result, “Most dislike ISIS in Muslim countries. Because Every Country Is The Best At Something. Trump's conflicts of interest: a visual guide. Trump's conflicts of interest: a visual guide By Nadja Popovich and Jan Diehm “I will be leaving my great business in total in order to fully focus on running the country in order to MAKE AMERICA GREAT AGAIN!”
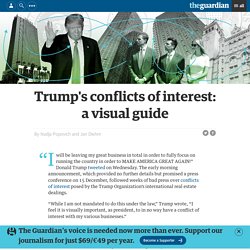
Donald Trump tweeted on Wednesday. The early morning announcement, which provided no further details but promised a press conference on 15 December, followed weeks of bad press over conflicts of interest posed by the Trump Organization’s international real estate dealings. “While I am not mandated to do this under the law,” Trump wrote, “I feel it is visually important, as president, to in no way have a conflict of interest with my various businesses.” So far, the visuals haven’t been good for the president-elect. Closer to home, the business interests of the Trump Organization will cross paths with the US government on multiple fronts, providing ample opportunity for further conflicts. General Services Administration v Trump International Hotel, DC. When Sea Levels Attack! — Information is Beautiful. Common MythConceptions — Information is Beautiful. Mountains Out of Molehills — Information is Beautiful.
There's Big Money to Be Made in Asteroid Mining. See the full version of the infographic. If humans were ever able to get their hands on just one asteroid, it would be a game-changer. That’s because the value of many asteroids are measured in the quintillions of dollars, which makes the market for Earth’s annual production of raw metals – about $660 billion per year – look paltry in comparison.
The reality is that the Earth’s crust is saddled with uneconomic materials, while certain types of asteroids are almost pure metal. X-type asteroids, for example, are thought to be the remnants of large asteroids that were pulverized in collisions in which their dense, metallic cores got separated from the mantle. There is one such X-type asteroid near earth that is believed to hold more platinum than ever mined in human history. Near-Earth Mining Targets. Below you'll find a nifty infographic produced by the folks at Yellowbrick detailing the consequences of everyone's favorite irritating childrearing trend: helicopter parenting.
We've written a lot about this topic here at Big Think; our archives are a veritable smorgasbord of pieces detailing its effects and consequences. Our focus isn't merely because we like to helicopter the helicopter parents, but because shifts in how we raise our kids have resulted in a generation of young adults who lack critical thinking, self-reliance, and coping skills. And that sucks not just for said young adults, but also for everyone else who has to deal with their problems. Billion Dollar-o-Gram 2013 Static — Information is Beautiful. Infographic: What country best fits your manners? How to make infographics: a beginner’s guide to data visualisation. As a growing number of international NGOs are using infographics, charts and interactive maps to share success and highlight disaster, how can organisations with less resources create high quality visualisations without having to pay to outsource them?
We’ve put together a beginner’s guide for visualising development data. Organising your data. Infografiche. Infographic & Flowchart. Infographics. Infographic: Evolution of classroom tech. By Robert Montenegro I dislike the term "millennial" for a lot of reasons, the most notable being that it promotes an intellectual laziness through which the word becomes synonymous with "young person.
" For a lot of 35-year-olds, anyone younger than them is a millennial. That's not exactly strong taxonomy. If we're going to look at generational differences in an intelligent manner (i.e., no mudslinging against lazy millennials and evil baby boomers), it's important we get on the same page with regard to where Generation Y splits with Generation Z. The latter is made up of what education writer Marc Prensky would call "Digital Natives," those who never experienced the pre-digital world. About Bones.
You probably don’t give much thought to your skeleton, even though it’s holding you together. Do you have as many bones now as you did when you were born?