
Best Infographics (@InfographicBest) True Colors: What You Brand Colors Say About Your Business. Studies have shown that a product’s color influences 60-80 percent of a customer’s purchasing decision, which makes choosing the wrong color a death sentence before your brand ever has a chance to get off the ground.
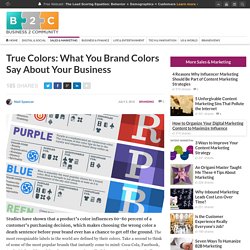
The most recognizable labels in the world are defined by their colors. Take a second to think of some of the most popular brands that instantly come to mind: Coca-Cola, Facebook, Apple, McDonalds, and Google – to name a few. All of these companies strategically use colors in their logo, website, and product to appeal to customers, making them instantly recognizable across the globe. Color is one of the first things people notice about a brand, and there are a few colors which get the most play: blue, red, black/grayscale, and yellow. 95 percent of companies only use one or two colors, 5 percent use more than two, 41 percent use text only, and 9 percent don’t feature the company name at all. Via: Marketo. Top 5 medical discoveries.
9 Graphic Design Trends for 2015. 10 Rules For Making An Infographic Effective & Viral. Advertisement We share a lot of infographics here on Bit Rebels.
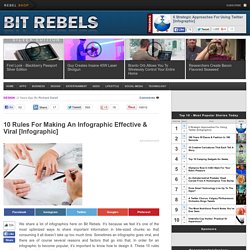
It’s because we feel it’s one of the most optimized ways to share important information in bite-sized chunks so that consuming it all doesn’t take up too much time. 20 Interesting Infographics on Design. Design is an extremely broad industry and there are trends, science, data, best practices, history and much more.
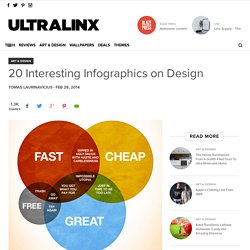
In this post I've collected 20 really interesting infographics on design that show you how to make your designs sell more, analyze clients, target right people and use other fields data. You may find this post longer than usual but it is definitely worth scrolling to see, learn and hopefully apply something for your own projects. Advertisement — Continue reading below. Cheat Sheet: Graphic Design Words Everyone Should Know (Infographic) In digital age, librarians are needed more than... Kate Hart: Citing Sources: A Quick and Graphic Guide. Academia has lots and lots and lots of systems in place for assuring that credit is always given where credit is due.
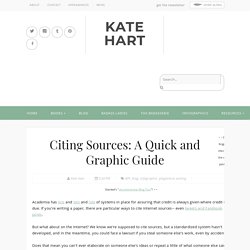
If you're writing a paper, there are particular ways to cite internet sources-- even tweets and Facebook posts. Facts You Probably Never Knew About Dreaming. Did you know that every face in your dreams is one that you have seen at some point in your life?
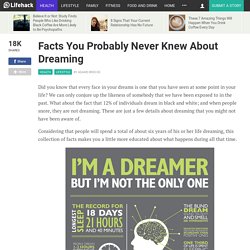
We can only conjure up the likeness of somebody that we have been exposed to in the past. What about the fact that 12% of individuals dream in black and white; and when people snore, they are not dreaming. 15 Golden Principles of Visual Hierarchy. Visual hierarchy adds beauty and order to your design.
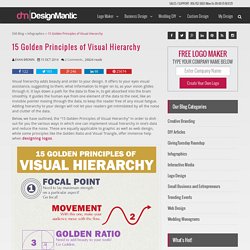
It offers to your eyes visual assistance, suggesting to them, what information to linger on to, as your vision glides through it. It lays down a path for the data to flow in, to get absorbed into the brain smoothly. It guides the human eye from one element of the data to the next, like an invisible pointer moving through the data, to keep the reader free of any visual fatigue. What Makes An #Infographic Bad And How To Make It Better. With the high demand for infographics, the same bad practices often pop up.
What Do Your Feet Say About You? [INFOGRAPHIC] - Daily Infographic. Freelance Or Office Infographic. Is flying solo your thing?
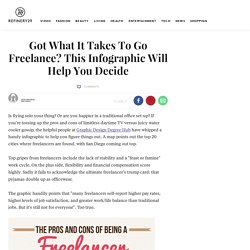
Or are you happier in a traditional office set-up? If you're tossing up the pros and cons of limitless daytime TV versus juicy water cooler gossip, the helpful people at Graphic Design Degree Hub have whipped a handy infographic to help you figure things out. A map points out the top 20 cities where freelancers are found, with San Diego coming out top. Top gripes from freelancers include the lack of stability and a "feast or famine" work cycle. On the plus side, flexibility and financial compensation score highly.
The graphic handily points that "many freelancers self-report higher pay rates, higher levels of job satisfaction, and greater work/life balance than traditional jobs. Freebie Release: "Modern Business" Infographic Elements. The landscape of business is constantly changing and so does the technology and marketing techniques involved.
A lot more businesses are using the power of infographics to really reach out to their target market. If you’re a designer doing some work for businesses in all shapes and sizes, chances are you have probably gotten some free vectors, PSDs and the like from Freepik. After all, Freepik is one of the biggest sites on the web for you to search for free vectors, stocks photos, PSD files and even SVG icons. How To Create Infographics (The Ultra-Simple & Easy Way) How Steve Jobs Started. 10 Ways to Use Infographics. Big data is one of the largest idea trends of 2013, and the biggest question surrounding it has been figuring out the best way to interpret it all.
Whether you are a corporation trying to communicate earnings and innovations to investors, a designer looking for a job that needs a unique resume, an organization that needs to effectively communicate the issues they care about, or an educator teaching a challenging topic in a short amount of time, the problem remains the same: how do you take the wealth of information at your disposal and effectively simplify and present it in an engaging and informative way? One answer is infographics. Infographics are graphic visual representations of data that are intended to present complex information quickly and clearly. The best way to explain an infographic is with another infographic (source: Customer Magnetism): This Infographic Reveals How to Raise Happy and Healthy Kids. Are Infographics Still Relevant? Top 5 Affordable Tools to Make Infographics. What makes infographics so popular?
The Science behind Why We Love Infographics [Infographic] It's okay, you can admit it—everyone loves a good infographic. I'd be lying to you if I didn't agree, especially being in the digital marketing field, but did you ever take the time to think about why we all fell in love with these beautiful displays of data points? Luckily, the team at NeoMam Studios did the legwork for us, compiling this infographic on the science behind why we love infographics. Instead of using the cop-out that "no one reads anymore," NeoMam Studios actually dug into the scientific reasoning behind what makes our brains tick in relation to infographics. One of the most interesting points is the fact that visual information has increased across all channels, with the Internet being the largest at a 9900% increase since 2007, and even newspapers made the jump, increasing the visuals in their content by 142% between 1985 and 1994.
Infographic via NeoMam Studios Thumbnail image via Shutterstock. Do Infographics Still Have an Audience? - Hit Reach.