
Create Easy Infographics, Reports, Presentations. 20+ Tools to Create Your Own Infographics. A picture is worth a thousand words – based on this, infographics would carry hundreds of thousands of words, yet if you let a reader choose between a full-length 1000-word article and an infographic that needs a few scroll-downs, they’d probably prefer absorbing information straight from the infographic. What’s not to like? Colored charts and illustrations deliver connections better than tables and figures and as users spend time looking back and forth the full infographic, they stay on the site longer. Plus, readers who like what they see are more likely to share visual guides more than articles. While not everyone can make infographics from scratch, there are tools available on the Web that will help you create your very own infographics.
In this article, we’re listing more than 20 such options to help you get your messages across to your readers, visually. Read Also: The Infographic Revolution: Where Do We Go From Here? What About Me? “What About Me?” Vizualize.me Piktochart easel.ly. 10 free tools for creating infographics. Done right, infographics can be a great way to make sense of complex data.
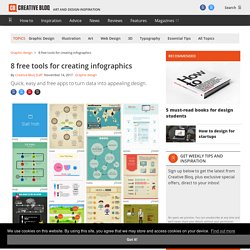
The best infographics transform complex information and data into graphics that are both easy to grasp and visually appealing. The only problem is, infographics that look like they were simple to make are often anything but. Exclusive offer: Save 15% on Adobe Creative Cloud now Here, we've selected our top free tools and apps for making infographics. Some of the options here are even suitable for non-designers, as templates and other features make them easy to use.
Give these free tools a try and let us know which ones you get on best with on Facebook or Twitter. 01. Visme promises to help you 'speak visually'. 02. Canva is a powerful and easy-to-use online tool that's suitable for all manner of design tasks, from brochures to presentations and much more besides. 03. Google's chart tools are powerful, simple to use, and free. 04. 05. 06. 07. 08. The Anatomy Of An Infographic: 5 Steps To Create A Powerful Visual. Information is very powerful but for the most bit it is bland and unimaginative.

Infographics channel information in a visually pleasing, instantly understandable manner, making it not only powerful, but extremely beautiful. Once used predominantly to make maps more approachable, scientific charts less daunting and as key learning tools for children, inforgraphics have now permeated all aspects of the modern world. I designed a couple of infographics back in college, the need arising especially around the time Soccer World Cup fever spiked. It was a fun process representing the different groups, predicting winners in each group at each stage and creating a mock pairing of teams that would clash all the way leading upto the finals. I was a devout Argentinian supporter at the time. Infographics can appear daunting to some with the sheer amount of data they present, but designed in the right manner and step by step, they can actually be one of the most fun things you will ever create. 1. 2.
Make Your Own Infographic. Infographics are to data what storytelling is to an annual report: a more engaging way to help bring attention and understanding to your nonprofit’s cause.
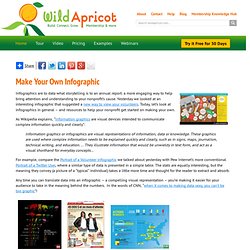
Yesterday we looked at an interesting infographic that suggested a new way to view your volunteers. Today, let’s look at infographics in general – and resources to help your nonprofit get started on making your own. As Wikipedia explains, “Information graphics are visual devices intended to communicate complex information quickly and clearly”: Information graphics or infographics are visual representations of information, data or knowledge. These graphics are used where complex information needs to be explained quickly and clearly, such as in signs, maps, journalism, technical writing, and education. ... For example, compare the Portrait of a Volunteer infographic we talked about yesterday with Pew Internet’s more conventional Portrait of a Twitter User, where a similar type of data is presented in a simple table.
Infographics & Data Visualization. 10 free tools for creating infographics. 46 Tools To Make Infographics In The Classroom. Infographics are interesting–a mash of (hopefully) easily-consumed visuals (so, symbols, shapes, and images) and added relevant character-based data (so, numbers, words, and brief sentences).
The learning application for them is clear, with many academic standards–including the Common Core standards–requiring teachers to use a variety of media forms, charts, and other data for both information reading as well as general fluency. It’s curious they haven’t really “caught on” in schools considering how well they bridge both the old-form textbook habit of cramming tons of information into a small space, while also neatly overlapping with the dynamic and digital world. So if you want to try to make infographics–or better yet have students make them–where do you start? The 46 tools below, curated by Faisal Khan, are a good place to start. 20+ Tools to Create Your Own Infographics. Create and share visual ideas online. Create Easy Infographics, Reports, Presentations.