
Clare Kelly sur Twitter : "Half an hour of using it and I'm a @qgis convert! #GIS... ESRI support policy and cost for Business Analyst. World #GIS #Data. Osm974. OSM2GIS. QGIS Plugin – Profile Tool : digital-geography.com. « Die Geojobs der Woche – KW 05 2013 more articles Free maps from the Perry-Castañeda library map collection » Previous Posts in this series QGIS Plugin – RasterCalcQGIS Plugin – OpenLayers So, this will be a pretty quick post on one of my most used QGIS plugins, the Profile tool.
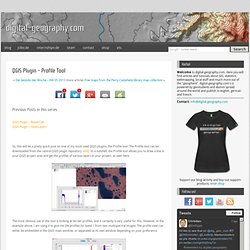
The Profile tool can be downloaded from the central QGIS plugin repository HERE. In a nutshell, the Profile tool allows you to draw a line in your QGIS project area and get the profiles of various layers in your project, as seen here: The most obvious use of this tool is looking at terrain profiles, and it certainly is very useful for this. The data generated from the tool can be output as an image file or output to a spreadsheet program. The Profile tool is easy to use and hopefully you will find new uses for in your projects. Video Thinking Spatially with #GIS - Accès aux soins - La carte de la fracture sanitaire. Protocole Analyse réalisée à partir des données publiques de l’Assurance maladie sur la localisation et les tarifs des médecins de 4 spécialités (généralistes, gynécologues, ophtalmologistes, pédiatres) relevées, au cours du 3ème trimestre 2012, sur www.ameli-direct.fr .
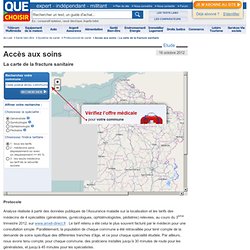
Le tarif retenu a été celui le plus souvent facturé par le médecin pour une consultation simple. Parallèlement, la population de chaque commune a été retravaillée pour tenir compte de la demande de soins spécifique des différentes tranches d’âge, et ce pour chaque spécialité étudiée. Par ailleurs, nous avons tenu compte, pour chaque commune, des praticiens installés jusqu’à 30 minutes de route pour les généralistes, et jusqu’à 45 minutes pour les spécialistes. Ces éléments ont permis de définir une densité de médecins disponibles pour 100 000 habitants. La définition que nous avons retenue pour les déserts médicaux est particulièrement favorable aux médecins.
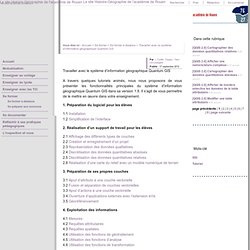
GéoLittoral - Visualisation des données. Travailler avec le système d'information géographique Quantum GIS. Accès direct au contenu Le site Histoire-Géographie de l’académie de Rouen Vous êtes ici : Accueil > Se former > Se former à distance > Travailler avec le système d’information géographique Quantum GIS Dans cette rubrique Mots-clé Par : Cyrille Chopin, Yann Le-Louargant Publié : 17 septembre 2012 Travailler avec le système d’information géographique Quantum GIS A travers quelques tutoriels animés, nous nous proposons de vous présenter les fonctionnalités principales du système d’information géographique Quantum GIS dans sa version 1.8. 1. 1.1 Installation1.2 Simplification de l’interface.
A world of tweets. ORBIS. Portail Information Géographique. Grand Port Maritime du Havre. Urban Population Map. Close Source United Nations, Department of Economic and Social Affairs (UNDESA), Population Division special updated estimates of urban population as of October 2011, consistent with World Population Prospects: The 2010 revision and World Urbanization Prospects: The 2009 revision.
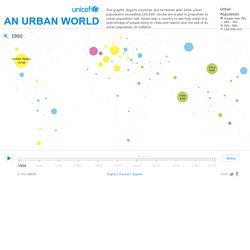
Graphic presentation of data based on The Guardian, 27 July 2007. This map is stylized and based on an approximate scale. It does not reflect a position by UNICEF on the legal status of any country or territory or the delimitation of any frontiers. Notes Because of the cession in July 2011 of the Republic of South Sudan by the Republic of the Sudan, and its subsequent admission to the United Nations on 14 July 2011, data for the Sudan and South Sudan as separate States are not yet available.
Data for China do not include Hong Kong and Macao, Special Administrative Regions of China. Data for France do not include French Guiana, Guadeloupe, Martinique, Mayotte and Reunion. Images from space track relentless spread of humanity. AIRE - Forêt (2000) Blog Géoclip O3, générateur d'observatoires. Evolution historique de Rouen. SNIG - Sistema Nacional de Informação Geográfica (versão Beta) Migrations Map: Where are migrants coming from? Where have migrants left?
Cartographie. LHS Stuttgart - GEOLiNE.flex. La Datar se penche sur les campagnes françaises. Atlas Caraïbe. GéOpenServices - le serveur WMS de Géosignal. Accueil. ALPAGE (diachronic analysis of the Paris urban area: a geomatic approach) is a research program coordinated by Hélène Noizet (LAMOP), which is supported by the ANR.
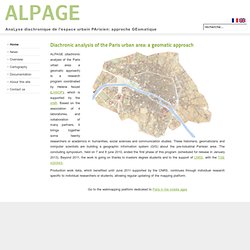
Based on the association of 4 laboratories, and collaboration of many partners, it brings together some twenty researchers or academics in humanities, social sciences and communication studies. These historians, geomaticians and computer scientists are building a geographic information system (GIS) about the pre-industrial Parisian area. The concluding symposium, held on 7 and 8 june 2010, ended the first phase of this program (scheduled for release in January 2013).
Beyond 2011, the work is going on thanks to masters degree students and to the support of CNRS, with the TGE ADONIS. Production work data, which benefited until June 2011 supported by the CNRS, continues through individual research specific to individual researchers or students, allowing regular updating of the mapping platform. Les cartes interactives de la population mondiale. Gas Trade Flow in Europe. Un monde en développement. Main § Digital Atlas of Roman and Medieval Civilization. Map.geo.admin.ch. The Atlas of Economic Complexity. France découverte O3. Recensement agricole 2010. The Scale of the Universe 2. SIG en ligne dans le monde. Mapping Center : Making a Large-Scale 3D Map: Part 3. Surging Seas: A Project of Climate Central.