

Mapping the Immigration and Emigration Patterns of New Yorkers Map Your Moves [moritz.stefaner.eu] represents more than 4,000 geographical immigration and emigration patterns from over 1,700 people in a beautiful, interactive interface. The data was collected during an informal survey by WNYC, a New York based public radio station. Each circle corresponds to a unique zip code area in New York. Its size indicates the number of moves to, or from, the area. Each circle actually consists of 2 overlaid circles: a red one for people moving out of a specific area, and a blue one for people moving into the area.
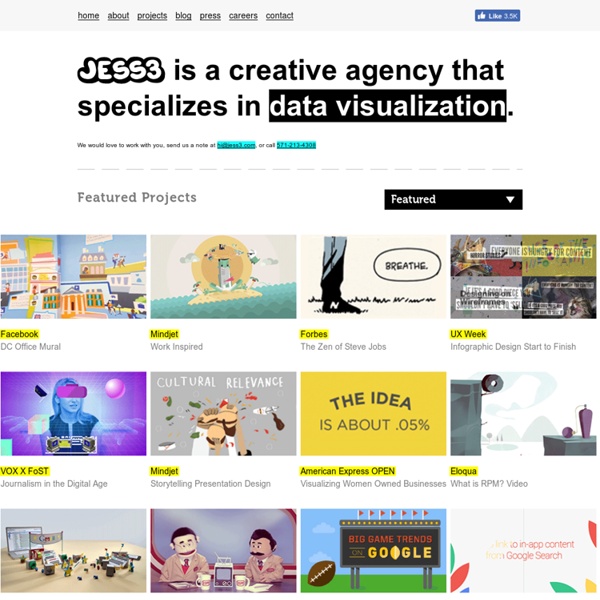
About At JESS3 we take complex topics and large data sets and make them accessible through beautiful visuals. We are a creative interactive agency that specializes in the art of data visualization, adding context and meaning to the exponentially growing world of data around us. About JESS3 - Founders Talk Mission and Vision from JESS3 on Vimeo. Our services range from UI / UX, animation, content creation and digital PR to developing large-scale installations, social strategies, data visualizations and infographics. Our client roster is a cross between Fortune 500 giants, media empires and start-up power-houses, including Samsung, Nike, Washington Post, Facebook, NASA, National Geographic, foursquare, Microsoft, C-SPAN, Turner Broadcasting and Google. But it doesn’t stop there.
Behaviorgraphics Humanize the Social Web inShare57 In 2007 Charlene Li, then at Forrester Research, now running the Altimeter Group, along with Forrester ‘s Josh Bernoff, Remy Fiorentino, and Sarah Glass released a report that introduced us to Social Technographics. Forrester’s research segmented participation behavior on the social web into six categories, visualized through a ladder metaphor with the rungs at the high end of the ladder indicating a greater level of participation. Social Technographics were designed to help businesses engage in social media with a more human approach, catering to individuals where, when, and how they are participating and contributing to the social Web. Visualisation 300.000 Norwegians move house every year. If the pattern made by their travels could be compressed into one short animation, what would it look like? What could you learn from it, if anything? Deluge is a C++ application designed to answer these questions. The data was generated by cross referencing 8 million tax records from 2006 and 2007 to track changes in postal codes. Norwegian tax returns
untitled Главная » English Welcome to Infographer (English version) This blog was created with the aim to facilitate the development of Data Visualization area in Russia, that is why it is mostly in Russian language. I am Irina Dobrova, working in Market&Consumer Researches in international FMCG company for many years, having sociological background. Home : SAGE Research Methods Online Simplify your research! Plan your research project with the help of SAGE Research Methods. With SAGE Research Methods, faculty, students, and researchers can: Learn how to design a research project Discover new methods to use in your research with the Methods Map Read over 175,000 pages of SAGE's renowed research methods content from leading global authors Browse content from over 720 books, dictionaries, encyclopedias, and handbooks Share content with colleagues and research partners using Methods Lists Explore related online journal content with the SAGE Journals widget Watch a video that answers key questions about research methods Click here to recommend SAGE Research Methods to your library.
About Face Media About Face is a video agency that brings brand communications goals to life by telling stories through documentary videos -- stories of employees, management or customers. Our videos aren't just documentary-style. They are actual documentaries made by acclaimed filmmakers, useful for public relations, employee relations, investor relations and customer engagement. Whether in corporate presentations or on Youtube, we tell your stories in a scalable, affordable and effective manner. From customer and employee testimonials, to product videos, to employee and management profile videos, we've produced thousands of genuine documentary stories for our clients and delivered many millions of highly targeted views. To do this we’ve pooled the talents of a network of video storytellers – acclaimed documentary filmmakers from all over the world.
Tweets from Tahrir Deaths in latest attack on Egypt's police#link# bodies recovered from S Korea ferry#link# 'blocks' UN envoy from Easter service#link# bomb blast kills policeman#link# killed in series of blasts in Iraq#link# divers remove first bodies from ferry #link# offers Easter truce in the east #link# avalanche death toll rises to 13#link# says reactor dispute 'virtually solved'#link# killed in Bahrain car blast#link# Pakistani journalist shot#link# army advances in besieged Homs#link# Korea divers see bodies inside sunken ferry#link# on S Sudan UN base may be 'war crime'#link# to 'help' Ukraine in overcoming crisis#link#
Original Content Marketing for Brands <a href=" by Qualaroo</a> Half a million members creating, sharing and exploring great visual content. Join us! Login with Facebookor your e-mail Sign UpLog In