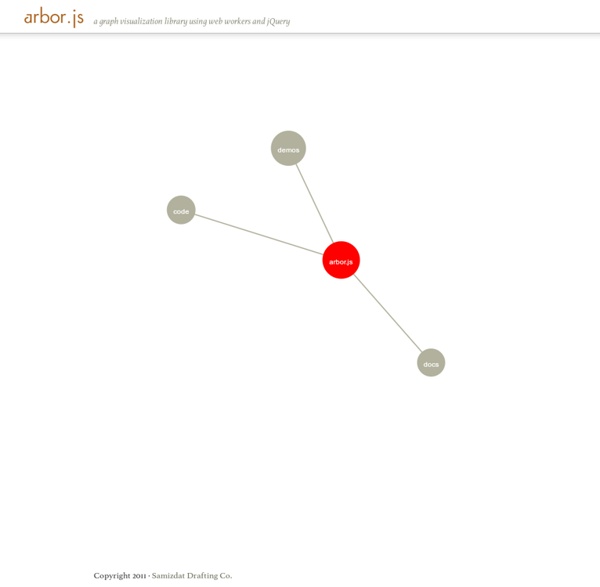


arbor.js » reference about arbor Arbor is a graph visualization library built with web workers and jQuery. Rather than trying to be an all-encompassing framework, arbor provides an efficient, force-directed layout algorithm plus abstractions for graph organization and screen refresh handling. AwesomeChartJS Description AwesomeChartJS is a simple Javascript library that can be used to create charts based on the HTML 5 canvas element. The main goal during development was to pick sane defaults in order to let the user create simple charts quickly with just a couple of lines of code. One can create at almost no time bar, pie, doughnut and Pareto charts. NOTE: If you are interested in a far more advanced, interactive JavaScript plotting library, take a look at Flot. Download
PhoneGap From Scratch: Introduction Want to learn how to use PhoneGap, but don't know where to get started? Join us as we put together "Sculder", not only a tribute to an excellent science fiction TV series, but a fully-fledged native mobile application for the believer in you! In this series, we will build a mobile application using some of the features in PhoneGap. progressive <canvas> pie charts Peity (sounds like deity) is a jQuery plugin that converts an element's content into a <svg> mini pie 2/5 donut 5,2,3 line 5,3,9,6,5,9,7,3,5,2 or bar chart 5,3,9,6,5,9,7,3,5,2 and is compatible with any browser that supports <svg>: Chrome, Firefox, IE9+, Opera, Safari. Download version 3.2.1 Uncompressed 8.7Kb
Demos - JavaScript InfoVis Toolkit JavaScript InfoVis Toolkit Create Interactive Data Visualizations for the Web Home ● Download ● Builder ● Donate Area, Bar and Pie Charts Sunburst Icicle humble finance - html5 visualization HumbleFinance is an HTML5 data visualization tool written as a demonstration of interactive graphing in HTML5. It is similar to the Flash tool on The tool itself is written entirely in JavaScript, using the Prototype and Flotr libraries. It can be used to display any two 2-D data sets of real numerical data which share an axis. Demo: This demo displays historical stock data for Google from their IPO to March 5th, 2010.
envision - demos Envision.js is a library for creating fast, dynamic and interactive HTML5 visualizations. Real-Time: TimeSeries template with real-time data. This demo features animation of the selection when new data arrives. The data itself is from a function but could be a callback to a remote data source. blog Hey friends! I gave in and finally integrated <canvas> support into JSViz, and just in time for the Safari 3 Beta (which I'm really digging so far)! Note: To render with canvas, you'll need Firefox 1.5, Safari 2.0, or Opera 9. JSViz gracefully degrades to alternative rendering platforms (SVG, HTML) when support is not present. Continue reading "Viva la Canvas" » I get lot's of e-mails from JSViz users that want to know how to integrate tooltips into their graphs.
Gantt - Editable JavaScript DHTML Gantt Chart with Rich API dhtmlxGantt is an open source JavaScript Gantt chart that helps you visualize a project schedule in a nice-looking chart. It can show the dependencies between tasks as lines and allows you to set up different relationships between tasks (finish-to-start, start-to-start, end-to-end). dhtmlxGantt provides flexible API and a large number of event handles, which gives you the freedom to customize it for your needs. Basic Gantt Chart Filtering and Zooming Hours Scale Baselines
Processing.js Demos below! As a sort-of reverse birthday present I’ve decided to release one of my largest projects, in recent memory. This is the project that I’ve been alluding to for quite some time now: I’ve ported the Processing visualization language to JavaScript, using the Canvas element. Cross-Browser JavaScript/HTML5 Charts - dhtmlxChart dhtmlxChart is a JavaScript charting library for generating cross-browser HTML5 charts. It supports the most common chart types: line, spline, area, bar, pie, donut, scatter, and radar charts. For complex charting needs, you can create a chart series, plotted separately side by side, or stacked. You can also display a combination of different charts types on a single chart (e.g. combine line and bar charts). Cytoscape.js This is how easy it is to get started with Cytoscape.js (this code creates the instance you see on the bottom-right: About Cytoscape.js is an open-source graph theory library written in JavaScript. You can use Cytoscape.js for graph analysis and visualisation.