Showcases on Datavisualization
Interactively Explore the YOLO Flip 12 Feb 2014 Showcases Animation, Interactive, Process, Sports In preparation of the Winter Olympic Games 2014 in Sochi, we helped the Swiss newspaper Neue Zürcher Zeitung publish a long-form article about Iouri Podladtchikov, a professional snowboarder and – since yesterday – freshly baked Olympic gold medalist. To help readers better understand the sport, we created a series of illustrations and an interactive animation. Read more Analyzing Presidential Candidate’s Body Language 11 Oct 2012 Showcases Politics, Video The New York Times recently examined the body language of the US presidential candidates Barack Obama and Mitt Romney. The Champions Ring 18 Jul 2012 Showcases Print, Radial, Sports Deroy Peraza from Hyperakt has published a huge collection of sports championships visualizations using radial brackets. Turn Your Location Into Jewelry With Meshu 08 Jun 2012 Showcases Jewelry, Mapping Meshu is a way to turn location data into physical objects.
Data Wrangler
UPDATE: The Stanford/Berkeley Wrangler research project is complete, and the software is no longer actively supported. Instead, we have started a commercial venture, Trifacta. For the most recent version of the tool, see the free Trifacta Wrangler. Why wrangle? Too much time is spent manipulating data just to get analysis and visualization tools to read it. Wrangler is designed to accelerate this process: spend less time fighting with your data and more time learning from it.
Working with Data in Protovis on Datavisualization
Protovis is an open-source Javascript visualization library by the Stanford Visualization Group and has become one of the preferred tools in our arsenal. If you want to get started with the popular toolkit too, Jerome Cukier has a comprehensive tutorial about how to work with data in Protovis. The tutorial is split in five parts covering using (1, 2), sorting (3) and reshaping (4) arrays as well as how to structure data to work with complex structures like treemaps or force-directed layouts (5). For the past year or so I have been dabbling with protovis. Be aware that the content is laser focused on how to deal with data instead of shiny visualization goodness. That said, if you plan to create custom visualizations with Protovis, I highly recommend to have a look at Jerome’s notes.
Setting Data Free With Gapminder
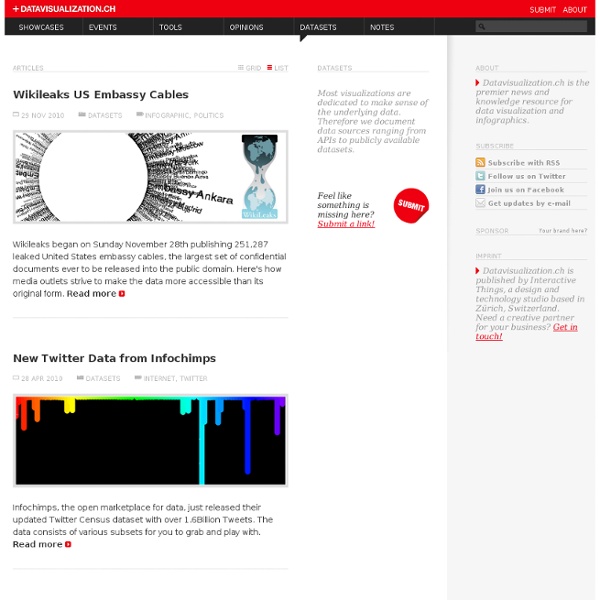
Last month Hans Rosling, the Swedish global health professor, statician and sword swallower released a desktop version of Gapminder World, his mesmerizing data visualization tool. Named one of Foreign Policy’s top 100 global thinkers in 2009, the information design visionary co-founded Gapminder.org with his son and daughter-in-law aiming to make the world’s most important trends accessible and digestible to global leaders, policy makers and the general public. The software they developed, Trendalyzer, (acquired by Google in 2007) translates static numbers into dynamic, interactive bubbles moving through time. The desktop version of Gapminder, which is still in beta, allows you to create and present graphs without an Internet connection. Emily Cunningham is a research intern at ReadWriteWeb and a design and user experience intern at OpenMRS.org. She is pursuing a Master in Information Management at University of Washington in Seattle, WA. What is Awesome What Needs Work In a word: social.
We Feel Fine / by Jonathan Harris and Sep Kamvar
New York Times - Linked Open Data
WriteFlow
Datavisualization.ch Selected Tools
Qu'est-ce que Traque Traces? | Traque traces, une fiction
Traque traces est une fiction. Mais c'est votre vie (ou presque) Cette fiction est née d'un pari un peu fou : refaire une ville fictive sous la vraie ville. Faire vivre et évoluer tout un peuple, écrit à partir des données qui nous écrivent, nous aussi, êtres de chair. Car chaque jour nous sommes, nous, êtres de chair, mis en données. C'est un constat. Nous avons donc écrit un peuple. Alors, comment lire? Plusieurs possibilités s'offrent à vous : rentrer par les coulisses de cette fabrique de fictions, qui expliquent la démarche poursuivie, les consignes d'écritures données séance après séance, et la construction progressive et plus erratique qu'il n'y paraît peut-être, de ce petit peuple qui nous ressemble tant.passer directement à la traque des personnages, par les lieux qu'ils ont hantés, par les tags qui les catégorisent et qui indexent les traces qu'ils ont laissées, ou en commençant par une histoire au hasard... Bonne traque.
20 visualisations de données en Motion design - motion_design
L'art de la visualisation de données progresse de plus en plus vite. Chaque semaine de nouvelles infographies ou webdesigns font leur apparition sur la toile. Mais que devient la vidéo dans tout ça? Découvrez le dans la suite de l'article. La visualisation de données par le motion design La création d'infographie prend un essor avec le flux d'informations que l'on reçoit chaque jour, les designers ont eu la bonne idée de jouer avec ce flux afin de le représenter graphiquement, soit à l'aide de sites web, d'infographies ou d'animations. Pour l'utilisation de la vidéo, on arrive à des résultats d'une grande qualité. Découvrez des à présent notre sélection spécialisée dans la visualisation de données par le motion design ! The World Is Obsessed With Facebook Energy & Dynamic Braking JESS3 x Economist: Women's Economic Opportunity Japan - The Strange Country (Japanese ver.) Performance Enhancement Dreaming in numbers Mobile Year in Review 2010 7 milliards, National Geographic Magazine
FlowingData | Data Visualization, Infographics, and Statistics