
EDge21 Home | Heurist Network Chart and image gallery: 30+ free tools for data visualization and analysis November 7, 2013 03:21 PM ET The chart below originally accompanied our story 22 free tools for data visualization and analysis (April 20, 2011). We're updating it as we cover additional tools, including 8 cool tools for data analysis, visualization and presentation (March 27, 2012) and Six useful JavaScript libraries for maps, charts and other data visualizations (March 6, 2013). Click through to those articles for full tool reviews. Features: You can sort the chart by clicking on any column header once to sort in ascending order and a second time to sort by descending (browser JavaScript required). Skill levels are represented as numbers from easiest to most difficult to learn and use: Users who are comfortable with basic spreadsheet tasks Users who are technically proficient enough not to be frightened off by spending a couple of hours learning a new applicationPower usersUsers with coding experience or specialized knowledge in a field like GIS or network analysis.
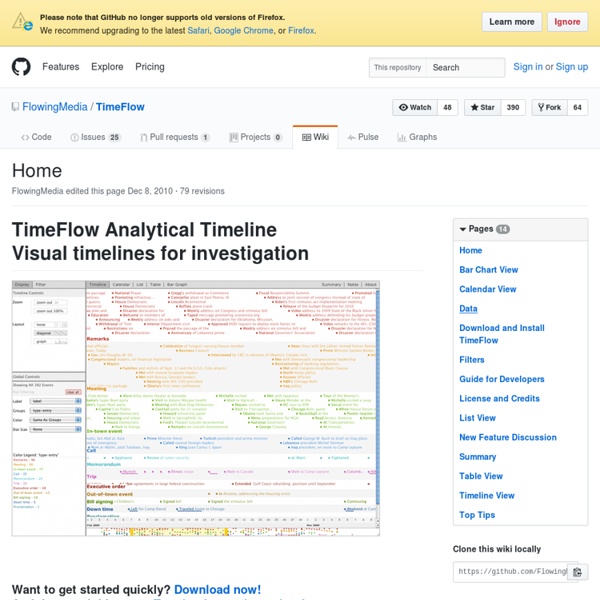
UNIX History Below, you can see the preview of the Unix History (move on the white zone to get a bigger image): This is a simplified diagram of unix history. There are numerous derivative systems not listed in this chart, maybe 10 times more! In the recent past, many electronic companies had their own unix releases. This diagram is only the tip of an iceberg, with a penguin on it ;-). If you want to print this timeline, you can freely download one of the following PDF files: Warning: it seems that Adobe Reader has some problems reading the large plotter version of the Unix History chart, but happily you can use another PDF viewer for this task. Here is the ChangeLog of this history. Note 1 : an arrow indicates an inheritance like a compatibility, it is not only a matter of source code. Note 2 : this diagram shows complete systems and [micro]kernels like Mach, Linux, the Hurd... Note 3 : I have now a page where I explain how I build this chart.
Mais - Recursos educacionais multimídia De Mais - Recursos educacionais multimídia Este repositório reúne de maneira organizada vários recursos educacionais (objetos de aprendizagem) multimídia disponíveis gratuitamente na internet para uso do professor e do estudante de Matemática. São mais de 150 recursos educacionais entre áudios, vídeos, softwares, textos e experimentos práticos. Últimos recursos adicionados: o vídeo The last banana e o livro Frações no Ensino Fundamental - Volume 1. Listas especiais Kturtle: diversos códigos prontos e materiais adicionais para quem deseja aprender a programar nesse ambiente de introdução à programação similar ao Logo Matmidias: lista com os objetos de aprendizagem utilizados nos cursos da série M@tmídias da SEcretaria de Educação do Estado de São Paulo Geogebra: alguns tutorias sobre o software Geogebra Origem e autoria Salientamos que a Mais não é autora da maior parte dos recursos educacionais aqui disponíveis, porém, todos estão sob licenças que permitem o uso e distribuição.
Nomenklatura - Data Matching and Reconciliation Made Easy - Open Knowledge Labs Nomenklatura is a simple service that makes it easy to maintain a canonical list of entities such as persons, companies or event streets and to match messy input, such as their names against that canonical list – for example, matching Acme Widgets, Acme Widgets Inc and Acme Widgets Incorporated to the canonical “Acme Widgets”. With Nomenklatura its a matters of minutes to set up your own set of master data to match against and it provides a simple user interface and API which you can then use do matching (the API is compatible with Open Refine’s reconciliation function). Nomenklatura can not only store the master set of entities you want to match against but also will learn and record the various aliases for a given entity - such as a person, organisation or place - may have in various datasets. As such Nomenklatura chooses a design half way between an entity database (such as OpenCorporates, PopIt or similar services) and a automated de-duplication software (such as dedupe or SILK).
Mind Tools - Management Training, Leadership Training and Career Training SMART Notebook Math Tools for Education Add-on to SMART Notebook software With SMART Notebook Math Tools you receive a variety of math-specific tools, as well as access to all the great features and Gallery items available in SMART Notebook software. SMART Notebook Math Tools embeds all the tools you need right into SMART Notebook software, saving you from running several different applications during a lesson. Customizable math toolbar Get instant access to math-specific tools within SMART Notebook software. Handwriting recognition and equation solving Handwrite questions on the fly - SMART Notebook Math Tools recognizes handwritten mathematical equations and symbols that can be solved and graphed. Advanced equation editor Insert and edit textbook-quality equations into your lesson activities with the advanced equation editor. Texas Instruments emulator integration If you have a Texas Instruments emulator, you can launch it with one click in SMART Notebook Math Tools. Table and graphing tools Graph Wizard New and improved shapes
Quickstart Guide | DSpace How do you know if DSpace is the right choice for you? How do you get started in your evaluation process? Follow the steps below to explore DSpace in more detail. Step 1 - Watch a DSpace overview Watch the DSpace introductory video. For a more in-depth preview, you can watch the one hour All About DSpace Webinar recording. Step 2 - Try DSpace for yourself Play with a demo version of DSpace and see how it works before you download and install the entire platform. Alternatively, you may work through the The DSpace Course with the DSpace Live CD, created by JISC's Repositories Support Project (RSP). Step 3 - Learn about how to set up a repository Review the Digital Repositories infoKit created by JISC/RSP, it is a practical 'how to' guide to setting up and running digital repositories. Alternatively you can review the LEADIRS Workbook: Creating an Institutional Repository. Step 4 - Learn about common DSpace customizations Step 5 - Refer to the DSpace documentation Step 6 - Still have questions?
DocumentationForUsers - google-refine - Documentation hub for users - Google Refine, a power tool for working with messy data (formerly Freebase Gridworks) My favorites ▼ | Sign in Project Home Downloads Wiki Comment by yoav.fre...@gmail.com, Feb 27, 2012 The reconcile service is incredible! Comment by k... how can I increase the HEAP? Comment by jeromest... After importing my data and creating a new project I am wondering how to save a project I am currently working on? One more question: Is a german version coming? Comment by Lyubany... while trying to import .json doc getting a message "Click on the first JSON { } node corresponding to the first record to load." Comment by vikalp.s... how to increased the heap size? Comment by louisagr... Hi, Is there a way to run jobs on the extraction of JSOM imported files to CSV? My goal is to run automated jobs running google refine with the output of a CSV file. Any help would be great, Best Regards! Comment by danoos... Great app. Comment by syed7... how to create a rdf extension with free base extension? Comment by hilmansu... ► Sign in to add a comment
Mathway | Math Problem Solver