
GraphUp - jQuery Plugin. GraphUp is a very flexible and lightweight jQuery (v1.4+) plugin to spice up your data tables.
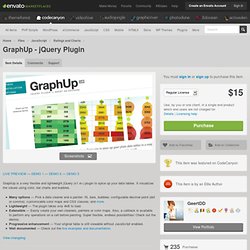
It visualizes the values using color, bar charts and bubbles. Many options — Pick a data cleaner and a painter: fill, bars, bubbles; configurable decimal point (dot or comma); customizable color maps and CSS classes; and more. Lightweight — The plugin takes only 4kB to load. Extensible — Easily create your own cleaners, painters or color maps. Also, a callback is available to perform any operations on a cell before painting. View changelog. 20 Fresh JavaScript Data Visualization Libraries. There are plenty of JavaScript libraries out there for rendering your otherwise plain and boring numerical data into beautiful, interactive, and informative visualizations.

The beauty of using JavaScript for data visualization is that, if created correctly, your data will be highly accessible (usually via HTML tables). A long time ago (2008), I wrote about JavaScript solutions for graphing and charting data and this article revisits the topic with twenty more JavaScript libraries that you can use to bring your data to life. 1. Highcharts Highcharts is one of the most promising JavaScript charting libraries to hit the scene recently, with its large array of features including seven charting types (line, pie, and bar among them), the ability to zoom in and out of charts, and tooltips for offering more information about data points. 2. gRaphaël gRaphaël is a charting library based on Raphaël, a vector graphics drawing JavaScript library. 3. 4. jQuery Visualize Plugin 5. moochart.
Creating animations with Dundas Chart for ASP.NET. This is a showcase review for our sponsors at CodeProject.
These reviews are intended to provide you with information on products and services that we consider useful and of value to developers. Download a Dundas Chart for .NET Evaluation View all Dundas articles Introduction. 10 Awesome Data Visualization Tools for the WebDigitalAnalog – An Online Publication for Creativity + Code. Data Visualization is an upcoming and exciting field that represents data in aesthetically pleasing and readily comprehensible form.
Instead of using boring excel sheets, data can be presented in a more creative format with the help of Data Visualization tools. The term Data Visualization is closely related to information graphics, information visualization, scientific visualization and statistical graphics. It presents complex sets of data in an interactive and intuitive way. There are many tools available online that can help you to create your own data visualizations easily and speedily. Today we take a look at some creative and interesting Data Visualization tools that web designers and developers might find useful. Arbor.js Arbor.js is a graph visualization library built with web workers and jQuery. D3.js This is a JavaScript library that helps in manipulating documents based on data. D3.js is not a monolithic framework that seeks to provide every conceivable feature. Envision.js. Twitter to Sell 50% of All Tweets for $360k/Year Through Gnip. Twitter announced today a new partnership with social data streaming service Gnip at the Defrag Conference outside of Denver: Gnip will offer 50% of all the messages posted to Twitter for $360,000 per year, or 5% of all messages for $60,000 per year.
Pricing is not yet on the Gnip site, but was disclosed in an interview with ReadWriteWeb. Customers will only be allowed to analyze the messages, not display them, and resale of the content itself will remain prohibited. The two companies emphasized that this is the first time a structured, reliable arrangement has been available for the many customers interested in purchasing a large quantity of streaming Tweets. Sale of the 100% full firehose will remain in the hands of Twitter itself. The full firehose contains approximately 1,000 Tweets every second. Is this price going to cut too many small innovators out of the market?
See social data developer Pete Warden's in-depth analysis of today's Twitter news earlier today on ReadWriteWeb. Public Participation Geographical Information Systems Research (The University of Manchester)