
38 Tools For Beautiful Data Visualisations. As we enter the Big Data era, it becomes more important to properly expand our capacity to process information for analysis and communication purposes.
In a business context, this is evident as good visualisation techniques can support statistical treatment of data, or even become an analysis technique. But also, can be used as a communication tool to report insights that inform decisions. Today there are plenty of tools out there that can be used to improve your data visualisation efforts at every level. Below we list a non-exhaustive list of resources. Javascript Libraries Circular Hierarchy – D3.js Python Libraries Kartograph.py – Mapsigraph – Node-link, treesMatplotlib – Most types of statistical plotsPycha – Pie chart, bar chart, area chartNetworkX – Node-link. Graphity Diagram Editor. Developer: Get started. KeyLines Geospatial. KeyLines Geospatial is a unique integration for visualizing connected data on maps.
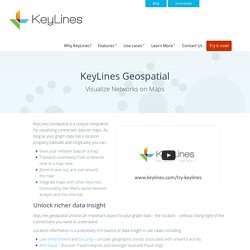
As long as your graph data has a location property (latitude and longitude), you can: View your network data on a mapTransition seamlessly from a network view to a map viewZoom in and out, and pan around the mapIntegrate maps with other KeyLines functionality, like filters, social network analysis and the time bar. Unlock richer data insight. Software - Online Flow charts software service with Realtime collaboration [2.4-rlive, updated 2014/03/27 19:57 UTC] Gephi Alternatives and Similar Software. Features.
Gephi is a tool for data analysts and scientists keen to explore and understand graphs. Like Photoshop™ but for graph data, the user interacts with the representation, manipulate the structures, shapes and colors to reveal hidden patterns. The goal is to help data analysts to make hypothesis, intuitively discover patterns, isolate structure singularities or faults during data sourcing. It is a complementary tool to traditional statistics, as visual thinking with interactive interfaces is now recognized to facilitate reasoning. This is a software for Exploratory Data Analysis, a paradigm appeared in the Visual Analytics field of research. Real-time visualization Profit from the fastest graph visualization engine to speed-up understanding and pattern discovery in large graphs. Layout Layout algorithms give the shape to the graph. Metrics The statistics and metrics framework offer the most common metrics for social network analysis (SNA) and scale-free networks.
Networks over time Input/Output. Navigator.
Atelier ICEBERG - Visualisation de l'information. Data Visualization software. Over 100 Incredible Infographic Tools and Resources (Categorized) This post is #6 in DailyTekk’s famous Top 100 series which explores the best startups, gadgets, apps, websites and services in a given category.

Total items listed: 112. Time to compile: 8+ hours. Follow @DailyTekk on Twitter to make sure you don’t miss a week! Infographics & Data Visualizations. Datavisualization.ch. Data Visualizations, Challenges, Community. Relation browser. This radial browser was designed to display complex concept network structures in a snappy and intuitive manner. It can be used to visualize conceptual structures, social networks, or anything else that can be expressed in nodes and links. CIA world factbook demo This demo displays the relations of countries, continents, languages and oceans found in the CIA world factbook database. Click the center node for detail information or click adjacent nodes to put them in the center. The arrows on the top left can be used to navigate your click history. Open source. Thinkmap Visual Thesaurus - An online thesaurus and dictionary of over 145,000 words that you explore using an interactive map.
Agriculture. Free mind mapping (and related types) software. There are regular inquiries on Twitter and in forums about free mind mapping software, so to provide answers, InformationTamers have put together this list.
We built this article, with permission, using the most complete source for details of information mapping software on the Web: Mind-mapping.org. Hat tip to Vic Gee who put Mind-mapping.org together and kept it up to date for years. [Update: I took over that site in August 2013.] Mind-mapping.org has a good capability for selecting software by map type and operating system (click on the 'Refine software list' tab at the top right of its web page), and shows the price.
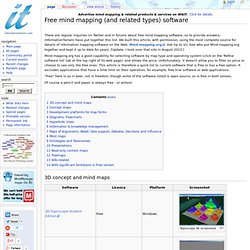
Unfortunately, it doesn't allow you to filter on price or choose to see only the free ones. "Free" here is as in beer, not in freedom, though some of the software listed is open source, so is free in both senses. Of course a pencil and paper is always free - or almost. 3D concept and mind maps Concept maps Development platforms for map forms Diagrams, Flowcharts. Calculatrice Sémantique en flash. Many Eyes. Mentionmap - A Twitter Visualization. Output: Jens Weber & Andreas Wolter. La visualisation dinformations. 50 Great Examples of Data Visualization. Tag Graph Photo Explorer sur Facebook. Visualization. Many Eyes. SEO Keyword Graph Visualization. Use this free Java application to explore the connections between related websites.
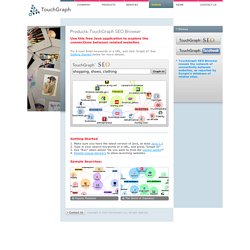
Try it now! Enter keywords or a URL, and click 'Graph it! ' See Getting Started below for more details. Getting Started Make sure you have the latest version of java, at least Java 1.5 Type in your search keywords or a URL, and press "Graph It! " Sample Searches: