
Data Viz. Neveldo/jQuery-Mapael. Free Data Visualization: 25 Best Tools. Date visualization can be a pain if one is not aware of the many tools one can use in its endeavor.
Data visualization is a process wherein data is shown in a simpler way in order for people to understand easily. Samples of data visualization tools include maps, graphs, pictures, and many more. There are many tools like this in the Internet, but none can be as effective as the 25 free visualization tools featured in this list. Some of these free visualization tools are being used for years now, while others are still new in the business. Some of these apps also try to broaden our approach to this quite tiring yet rewarding part of information technology.
Worth to Read : Creating Charts, Diagrams and Flowcharts. World.geo.json/countries.geo.json at master · johan/world.geo.json. Democratie, représentation open data. Hack Your Maps. Web maps have come a long way.
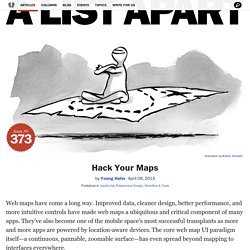
Improved data, cleaner design, better performance, and more intuitive controls have made web maps a ubiquitous and critical component of many apps. They’ve also become one of the mobile space’s most successful transplants as more and more apps are powered by location-aware devices. The core web map UI paradigm itself—a continuous, pannable, zoomable surface—has even spread beyond mapping to interfaces everywhere.
Article Continues Below Despite all this, we’ve barely begun to work web maps into our design practice. Have you ever taken apart a map? This article is a long overdue companion to Paul’s piece. Opinionated about open#section1 Paul makes a strong case for why you might want to use open mapping tools instead of the established incumbent. There is nothing mysterious about web maps. In short, we’ll be working with a fully open mapping stack. Starting out#section2 I’m a big fan of Sherlock Holmes. A tale of places#section3. Protovis.
Protovis composes custom views of data with simple marks such as bars and dots.
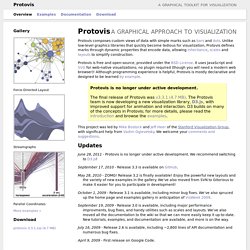
Unlike low-level graphics libraries that quickly become tedious for visualization, Protovis defines marks through dynamic properties that encode data, allowing inheritance, scales and layouts to simplify construction. Protovis is free and open-source, provided under the BSD License. It uses JavaScript and SVG for web-native visualizations; no plugin required (though you will need a modern web browser)! Although programming experience is helpful, Protovis is mostly declarative and designed to be learned by example. Protovis is no longer under active development.The final release of Protovis was v3.3.1 (4.7 MB). This project was led by Mike Bostock and Jeff Heer of the Stanford Visualization Group, with significant help from Vadim Ogievetsky. Updates June 28, 2011 - Protovis is no longer under active development. September 17, 2010 - Release 3.3 is available on GitHub. May 28, 2010 - ZOMG! Getting Started. The NYT's Visual Election Outcome Explorer.
The interactive tree allows readers to explore US Presidential election scenarios centered on battleground states How we made the interactive D3 decision tree The Project: 512 Paths to the White House The space of electoral college calculators is fairly well-trodden, so at first it seemed hard to do something new.
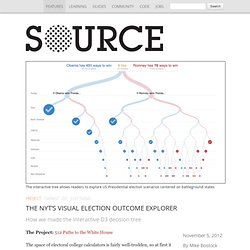
The big problem here is the combinatorial explosion (2^n): even if you consider only nine states, you have 512 possible outcomes! So, you don’t offer much insight by simply enumerating outcomes or allowing undirected exploration. We settled on a binary tree early on, but it wasn’t until Shan had the idea of collapsing parts of the tree into “decision” nodes that the design clicked. The Design Process Shan and I work out of the San Francisco bureau of The New York Times, but we are in constant contact with our esteemed colleagues in Manhattan.
A question I often ask: what is the most salient aspect of the visualization? Building It Sketch of sample tree Annotations and Examples. The Mapping London Blog. Knoema - Home. Le carroyage avec QGIS et le plugin QMarxan, c'est facile! Article en français "Gridding for the dummies" ;) with Quantum GIS and QMarxan: In this article, I explain the purpose of gridding, why it is such an efficient way to analyse data within a large community of actors. Actually, gridding can be considered as a transcription of the raster format to the vector one where one tile <=> one cell. Thanks to QMarxan, gridding with QGIS is really simple: you don't need any knowledge in PostGIS, GRASS and R to do it. That's what we'll see: in the end of the post, I detail how to constitute some gridded data through a case study aiming to process a building density analysis on the city of Paris.
The article is in French, but the printscreens will be helpful for the understanding. All the material used in this article is free: Quantum GIS, OpenStreetMap for the buildings and INSEE (equivalent of US Census) for the population data. Maillage / Carroyage Le carroyage est un mode de représentation des données vecteur par carreau. Potentiel du carroyage. Big ideas worth pursuing.