
123 data, Espace fondation groupe edf, Du 4 mai au 6 octobre 2018. 12 Extraordinary Maps By Leading Creative Minds. Before Google Maps came along, cartographers were artists as much as they were charters of geographies, and maps were aesthetic objects as much as they were wayfinding tools.

In Mapping it Out: An Alternative Atlas of Contemporary Cartographies, Hans Ulrich Obrist, curator of the Serpentine Gallery, brings artistry and imagination back to mapmaking. In an effort to rethink what maps can be and do, he invited 130 artists, designers, writers, scientists, architects, and thinkers to create maps, of interior or exterior worlds, real or imagined, in any medium. The result is a visually arresting volume filled with works by the likes of Yoko Ono, Matthew Barney, Ed Ruscha, and Gilbert and George, combining infographics and cartography with contemporary art and science. Courtesy of Thames & Hudson Maps are not copies, they are projections . . . Mapping it Out: An Alternative Atlas of Contemporary Cartographies is available for $42 from Thames & Hudson.
[©Jacques Roubaud. Julia sur Twitter : "À chacun sa #NikideSaintPhalle #cartographie via @GrandPalaisRmn...
Live Map. Best-infographics-data-vizualisation-28.jpg (Image JPEG, 1280x853 pixels) - Redimensionnée (98%) Infographie-sur-les-infographies.jpg (Image JPEG, 550x660 pixels) Les 50 meilleures infographics et data visualization. Chinese: The New Dominant Language of the Internet [Infographic]
21 December '10, 06:29pm Follow China gained 36 million additional internet users last year meaning there are now over 440 million internet users in the country.
![Chinese: The New Dominant Language of the Internet [Infographic]](http://cdn.pearltrees.com/s/pic/th/dominant-language-infographic-8791651)
English has long been the most widely used language on the internet but with Chinese Internet growth rising at the rate it is, it could be less than five years before Chinese becomes the dominant language on the internet. Entretien avec David McCandless : l'information par la visualisation. Quand on évoque la datavisualisation, en télévision, publicité, presse ou Internet, il est difficile de ne pas parler de David McCandless.
Pionnier du design d'information, il est le prochain invité des Rencontres RSLN organisées dans le cadre des Techdays au Palais des Congrès le vendredi 14 février prochain (entrée libre, inscription ici). Autrefois spécialisé dans les jeux vidéo, David McCandless s'est peu à peu diversifié. Depuis la publication de son livre « Information is beautiful » en 2009, il est devenu l'une des références internationales du journalisme de données. S'il navigue entre différents secteurs, le « pape de la datavisualisation » répète toujours la même règle : les données doivent transmettre une véritable information pour être traitées et permettre ainsi de raconter une belle histoire. RSLN : Ces dernières années, vous avez multiplié les projets et les réalisations. Comment définir le design d’information ? Visualisation. Visualisation de données : rencontre avec David McCandless » Article » OWNI, Digital Journalism.
Le journaliste du Guardian tient le site "Information is beautiful", sur lequel il met en scène toutes sortes de données.
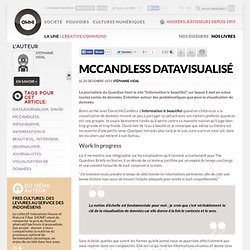
Entretien autour des problématiques que pose la visualisation de données. Boire un thé avec David McCandless d’Information is beautiful quand on s’intéresse à la visualisation de données revient un peu à partager un pétard avec ses rockers préférés quand on est une groupie. Je souris béatement tandis qu’il peste contre sa nouvelle maison qu’il juge bien trop grande et trop froide. David met de l’eau à bouillir et je remarque que même sa théière est recouverte d’une petite laine. Quelques instants plus tard, je le suis, sans sucre et sans lait, dans les escaliers qui mènent à son bureau. Work In progress Là, il me montre une infographie sur les exoplanètes qu’il termine actuellement pour The Guardian.
La notion d’échelle est fondamentale pour moi ; je crois que c’est véritablement la clé de la visualisation de données car elle donne à la fois le contexte et le sens. Ideas, issues, knowledge, data - visualized! It's the Inequality, Stupid. Want more charts like these?
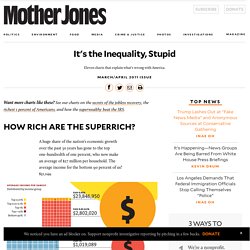
See our charts on the secrets of the jobless recovery, the richest 1 percent of Americans, and how the superwealthy beat the IRS. How Rich Are the Superrich? A huge share of the nation's economic growth over the past 30 years has gone to the top one-hundredth of one percent, who now make an average of $27 million per household. The average income for the bottom 90 percent of us? $31,244. Note: The 2007 data (the most current) doesn't reflect the impact of the housing market crash. Winners Take All The superrich have grabbed the bulk of the past three decades' gains. Download: PDF chart 1 (large) PDF chart 2 (large) | JPG chart 1 (smaller) JPG chart 2 (smaller) Out of Balance A Harvard business prof and a behavioral economist recently asked more than 5,000 Americans how they thought wealth is distributed in the United States.
Download: PDF (large) | JPG (smaller) Capitol Gain Why Washington is closer to Wall Street than Main Street. Congressional data from 2009.