
Normal Distribution & Z-scores. How To Calculate Standard Deviation by sonia. First, you need to determine the mean.
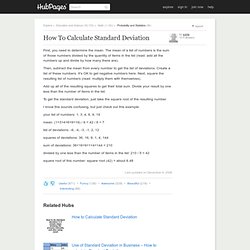
The mean of a list of numbers is the sum of those numbers divided by the quantity of items in the list (read: add all the numbers up and divide by how many there are). Then, subtract the mean from every number to get the list of deviations. Create a list of these numbers. It's OK to get negative numbers here. Next, square the resulting list of numbers (read: multiply them with themselves). Add up all of the resulting squares to get their total sum. To get the standard deviation, just take the square root of the resulting number I know this sounds confusing, but just check out this example: your list of numbers: 1, 3, 4, 6, 9, 19 mean: (1+3+4+6+9+19) / 6 = 42 / 6 = 7 list of deviations: -6, -4, -3, -1, 2, 12 squares of deviations: 36, 16, 9, 1, 4, 144 sum of deviations: 36+16+9+1+4+144 = 210 divided by one less than the number of items in the list: 210 / 5 = 42 square root of this number: square root (42) = about 6.48. How%20to%20use%2084%20for%20normal.
Stats: Introduction to Estimation. One area of concern in inferential statistics is the estimation of the population parameter from the sample statistic.
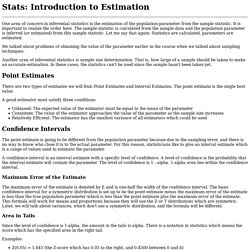
It is important to realize the order here. The sample statistic is calculated from the sample data and the population parameter is inferred (or estimated) from this sample statistic. Let me say that again: Statistics are calculated, parameters are estimated. We talked about problems of obtaining the value of the parameter earlier in the course when we talked about sampling techniques. Another area of inferential statistics is sample size determination. Point Estimates There are two types of estimates we will find: Point Estimates and Interval Estimates. A good estimator must satisfy three conditions: Confidence Intervals The point estimate is going to be different from the population parameter because due to the sampling error, and there is no way to know who close it is to the actual parameter.
Maximum Error of the Estimate Area in Tails Examples: Z-score Calculations & Percentiles in a Normal Distribution. Understanding P Values. Excel Basics Finding areas under the normal distribution. 5) Enter into cell A16 "M", B16 "SD", C16 "X1", D16 "X2", E16 "Z1", F16 "Z2",G16 "F(Z1)", H16 "F(Z2)", I16 "p".
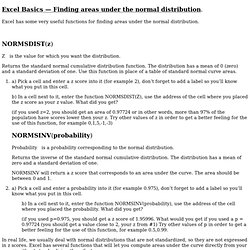
Enter the values 100,2,96,104 below m, S.D, x1, x2 respectively. These values are usually given to you in questions. Below Z1 we will calculate the standard score of X1. There are two ways to do this, either using the formula we learned in class (X-m )/σ or using the excel function STANDARDIZE(x, mean, S.D). Choose either one of them. Calculate Z2 in the same way. Given the Z scores in E17 and F17, which Excel function would you use to calculate the area under the curve? In order to calculate the area between these two scores, or the probability that a score would fall between X1 and X2, calculate the difference between F(Z2) and F(Z1) in cell I17.
This could be very useful when working on the homework problems. We are given the mean height of a Merkin plant m=65 and the S.D = 3. What is the probability that the plant will be between 64 and 67 inches tall? Hypothesis Testing and P-values. One-Tailed and Two-Tailed Tests. Normal calculator Upper & Lower Bounds. Z-Score to Percentile Calculator. Percentile to Z-Score Calculator.
Interactive Normal Curve. Z-Score to Percentile Calculator. Sets, Counting, and Probability.